Download
1 / 1
20 likes | 201 Views
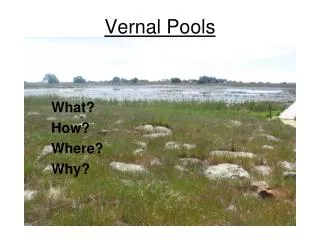
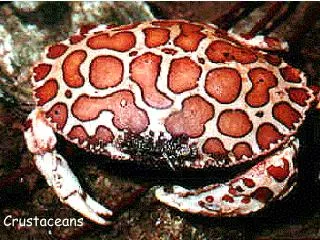
Ostracods vs. Cladocerans Examining Competition Between Two Vernal Pool Crustaceans. Russell Croel BIO 260 Spring 2012. INTRODUCTION. ABSTRACT. DISCUSSION.

E N D
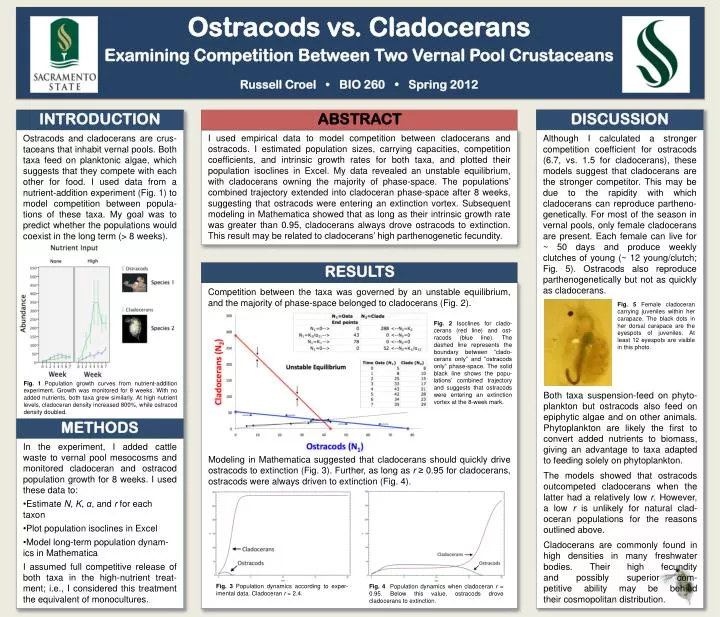
Ostracods vs. Cladocerans Examining Competition Between Two Vernal Pool Crustaceans Russell Croel BIO 260 Spring 2012 INTRODUCTION ABSTRACT DISCUSSION I used empirical data to model competition between cladocerans and ostracods. I estimated population sizes, carrying capacities, competition coefficients, and intrinsic growth rates for both taxa, and plotted their population isoclines in Excel. My data revealed an unstable equilibrium, with cladocerans owning the majority of phase-space. The populations’ combined trajectory extended into cladoceran phase-space after 8 weeks, suggesting that ostracods were entering an extinction vortex. Subsequent modeling in Mathematica showed that as long as their intrinsic growth rate was greater than 0.95, cladocerans always drove ostracods to extinction. This result may be related to cladocerans’ high parthenogenetic fecundity. Ostracods and cladocerans are crus-taceans that inhabit vernal pools. Both taxa feed on planktonic algae, which suggests that they compete with each other for food. I used data from a nutrient-addition experiment (Fig. 1) to model competition between popula-tions of these taxa. My goal was to predict whether the populations would coexist in the long term (> 8 weeks). WATER CHEMISTRY In the high-dung mesocosms, water chemistry showed classic signs of eutrophication. Although I calculated a stronger competition coefficient for ostracods (6.7, vs. 1.5 for cladocerans), these models suggest that cladocerans are the stronger competitor. This may be due to the rapidity with which cladocerans can reproduce partheno-genetically. For most of the season in vernal pools, only female cladocerans are present. Each female can live for ~ 50 days and produce weekly clutches of young (~ 12 young/clutch; Fig. 5). Ostracods also reproduce parthenogenetically but not as quickly as cladocerans. RESULTS Competition between the taxa was governed by an unstable equilibrium, and the majority of phase-space belonged to cladocerans (Fig. 2). Fig. 5 Female cladoceran carrying juveniles within her carapace. The black dots in her dorsal carapace are the eyespots of juveniles. At least 12 eyespots are visible in this photo. Fig. 2 Isoclines for clado-cerans (red line) and ost-racods (blue line). The dashed line represents the boundary between “clado-cerans only” and “ostracods only” phase-space. The solid black line shows the popu-lations’ combined trajectory and suggests that ostracods were entering an extinction vortex at the 8-week mark. Fig. 1 Population growth curves from nutrient-addition experiment. Growth was monitored for 8 weeks. With no added nutrients, both taxa grew similarly. At high nutrient levels, cladoceran density increased 800%, while ostracod density doubled. Both taxa suspension-feed on phyto-plankton but ostracods also feed on epiphytic algae and on other animals. Phytoplankton are likely the first to convert added nutrients to biomass, giving an advantage to taxa adapted to feeding solely on phytoplankton. The models showed that ostracods outcompeted cladocerans when the latter had a relatively low r. However, a low r is unlikely for natural clad-oceran populations for the reasons outlined above. Cladocerans are commonly found in high densities in many freshwater bodies. Their high fecundityand possibly superior com-petitive ability may be behindtheir cosmopolitan distribution. METHODS • In the experiment, I added cattle waste to vernal pool mesocosms and monitored cladoceran and ostracod population growth for 8 weeks. I used these data to: • Estimate N,K, α, and r for each taxon • Plot population isoclines in Excel • Model long-term population dynam-ics in Mathematica • I assumed full competitive release of both taxa in the high-nutrient treat-ment; i.e., I considered this treatment the equivalent of monocultures. Modeling in Mathematica suggested that cladocerans should quickly drive ostracods to extinction (Fig. 3). Further, as long as r ≥ 0.95 for cladocerans, ostracods were always driven to extinction (Fig. 4). Fig. 3 Population dynamics according to exper-imental data. Cladoceran r = 2.4. Fig. 4 Population dynamics when cladoceran r = 0.95. Below this value, ostracods drove cladocerans to extinction.