Download
1 / 1
10 likes | 102 Views
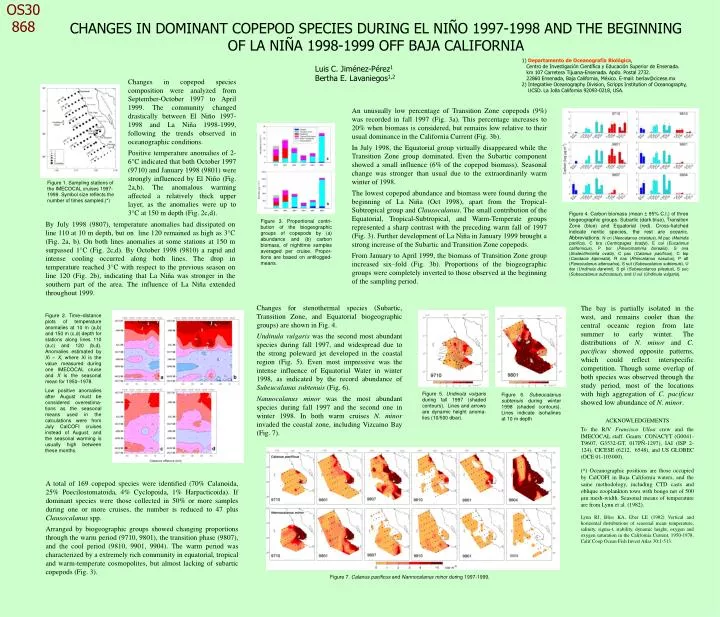
OS30 868. Figure 1. Sampling stations of the IMECOCAL cruises 1997-1999. Symbol size reflects the number of times sampled.(*).

E N D
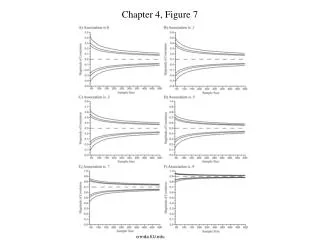
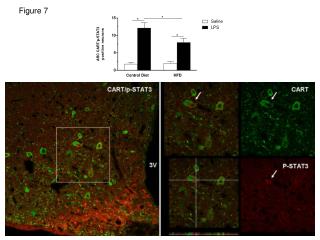
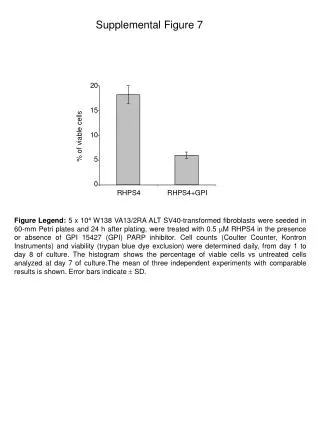
OS30 868 Figure 1. Sampling stations of the IMECOCAL cruises 1997-1999. Symbol size reflects the number of times sampled.(*) Figure 4. Carbon biomass (mean ± 95% C.I.) of three biogeographic groups: Subartic (dark blue), Transition Zone (blue) and Equatorial (red). Cross-hatched indicate neritic species, the rest are oceanic. Abbreviations: N cri (Neocalanus cristatus), M pac (Metridia pacifica), C bra (Centropages bradyi), E cal (Eucalanus californicus), P bor (Pleuromamma borealis), S ova (Scolecithricella ovata), C pac (Calanus pacificus), C bip (Candacia bipinnata), R nas (Rhincalanus nasutus), P att (Pareucalanus attenuatus), S sut (Subeucalanus subtenuis), U dar (Undinula darwinii), S pil (Subeucalanus pileatus), S suc (Subeucalanus subcrassus), and U vul (Undinula vulgaris). Figure 2. Time–distance plots of temperature anomalies at 10 m (a,b) and 150 m (c,d) depth for stations along lines 110 (a,c) and 120 (b,d). Anomalies estimated by Xi – X, where Xi is the value measured during one IMECOCAL cruise and X is the seasonal mean for 1950–1978. Low positive anomalies after August must be considered overestima-tions as the seasonal means used in the calculations were from July CalCOFI cruises instead of August, and the seasonal warming is usually high between these months. Figure 3. Proportional contri-bution of the biogeographic groups of copepods by (a) abundance and (b) carbon biomass, of nighttime samples averaged per cruise. Propor-tions are based on antilogged-means. Figure 5. Undinula vulgaris during fall 1997 (shaded contours). Lines and arrows are dynamic height anoma-lies (10/500 dbar). Figure 6. Subeucalanus subtenuis during winter 1998 (shaded contours). Lines indicate isohalines at 10 m depth Figure 7. Calanus pacificus and Nannocalanus minor during 1997-1999. CHANGES IN DOMINANT COPEPOD SPECIES DURING EL NIÑO 1997-1998 AND THE BEGINNING OF LA NIÑA 1998-1999 OFF BAJA CALIFORNIA 1) Departamento de Oceanografía Biológica, Centro de Investigación Científica y Educación Superior de Ensenada. km 107 Carretera Tijuana-Ensenada. Apdo. Postal 2732. 22860 Ensenada, Baja California, México. E-mail: berlav@cicese.mx 2) Integrative Oceanography Division, Scripps Institution of Oceanography, UCSD. La Jolla California 92093-0218, USA. Luis C. Jiménez-Pérez1 Bertha E. Lavaniegos1,2 Changes in copepod species composition were analyzed from September-October 1997 to April 1999. The community changed drastically between El Niño 1997-1998 and La Niña 1998-1999, following the trends observed in oceanographic conditions. Positive temperature anomalies of 2-6°C indicated that both October 1997 (9710) and January 1998 (9801) were strongly influenced by El Niño (Fig. 2a,b). The anomalous warming affected a relatively thick upper layer, as the anomalies were up to 3°C at 150 m depth (Fig. 2c,d). An unusually low percentage of Transition Zone copepods (9%) was recorded in fall 1997 (Fig. 3a). This percentage increases to 20% when biomass is considered, but remains low relative to their usual dominance in the California Current (Fig. 3b). In July 1998, the Equatorial group virtually disappeared while the Transition Zone group dominated. Even the Subartic component showed a small influence (6% of the copepod biomass). Seasonal change was stronger than usual due to the extraordinarily warm winter of 1998. The lowest copepod abundance and biomass were found during the beginning of La Niña (Oct 1998), apart from the Tropical-Subtropical group and Clausocalanus. The small contribution of the Equatorial, Tropical-Subtropical, and Warm-Temperate groups represented a sharp contrast with the preceding warm fall of 1997 (Fig. 3). Further development of La Niña in January 1999 brought a strong increase of the Subartic and Transition Zone copepods. From January to April 1999, the biomass of Transition Zone group increased six–fold (Fig. 3b). Proportions of the biogeographic groups were completely inverted to those observed at the beginning of the sampling period. By July 1998 (9807), temperature anomalies had dissipated on line 110 at 10 m depth, but on line 120 remained as high as 3°C (Fig. 2a, b). On both lines anomalies at some stations at 150 m surpassed 1°C (Fig. 2c,d). By October 1998 (9810) a rapid and intense cooling occurred along both lines. The drop in temperature reached 3°C with respect to the previous season on line 120 (Fig. 2b), indicating that La Niña was stronger in the southern part of the area. The influence of La Niña extended throughout 1999. Changes for stenothermal species (Subartic, Transition Zone, and Equatorial biogeographic groups) are shown in Fig. 4. Undinula vulgaris was the second most abundant species during fall 1997, and widespread due to the strong poleward jet developed in the coastal region (Fig. 5). Even most impressive was the intense influence of Equatorial Water in winter 1998, as indicated by the record abundance of Subeucalanus subtenuis (Fig. 6). Nannocalanus minor was the most abundant species during fall 1997 and the second one in winter 1998. In both warm cruises N. minor invaded the coastal zone, including Vizcaino Bay (Fig. 7). The bay is partially isolated in the west, and remains cooler than the central oceanic region from late summer to early winter. The distributions of N. minor and C. pacificus showed opposite patterns, which could reflect interspecific competition. Though some overlap of both species was observed through the study period, most of the locations with high aggregation of C. pacificus showed low abundance of N. minor. ACKNOWLEDGEMENTS To the R/V Francisco Ulloa crew and the IMECOCAL staff. Grants: CONACYT (G0041-T9607, G3532-GT, 017PÑ-1297), IAI (ISP 2-124), CICESE (6212, 6548), and US GLOBEC (OCE 01-103000). (*) Oceanographic positions are those occupied by CalCOFI in Baja California waters, and the same methodology, including CTD casts and oblique zooplankton tows with bongo net of 500 µm mesh-width. Seasonal means of temperature are from Lynn et al. (1982). Lynn RJ, Bliss KA, Eber LE (1982) Vertical and horizontal distributions of seasonal mean temperature, salinity, sigma-t, stability, dynamic height, oxygen and oxygen saturation in the California Current, 1950-1978. Calif Coop Ocean Fish Invest Atlas 30:1-513. A total of 169 copepod species were identified (70% Calanoida, 25% Poecilostomatoida, 4% Cyclopoida, 1% Harpacticoida). If dominant species were those collected in 50% or more samples during one or more cruises, the number is reduced to 47 plus Clausocalanus spp. Arranged by biogeographic groups showed changing proportions through the warm period (9710, 9801), the transition phase (9807), and the cool period (9810, 9901, 9904). The warm period was characterized by a extremely rich community in equatorial, tropical and warm-temperate cosmopolites, but almost lacking of subartic copepods (Fig. 3).