Download
1 / 1
10 likes | 109 Views
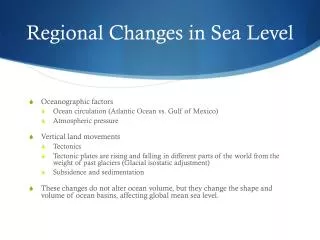
TOWARDS REGIONAL SEA-LEVEL CURVES FOR THE GEOLOGICAL PAST. Bert Vermeersen , Paolo Stocchi & Henk Brinkhuis ( NIOZ Royal Netherlands Institute for Sea Research ). The Present

E N D
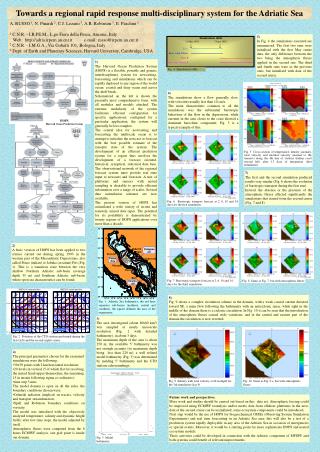
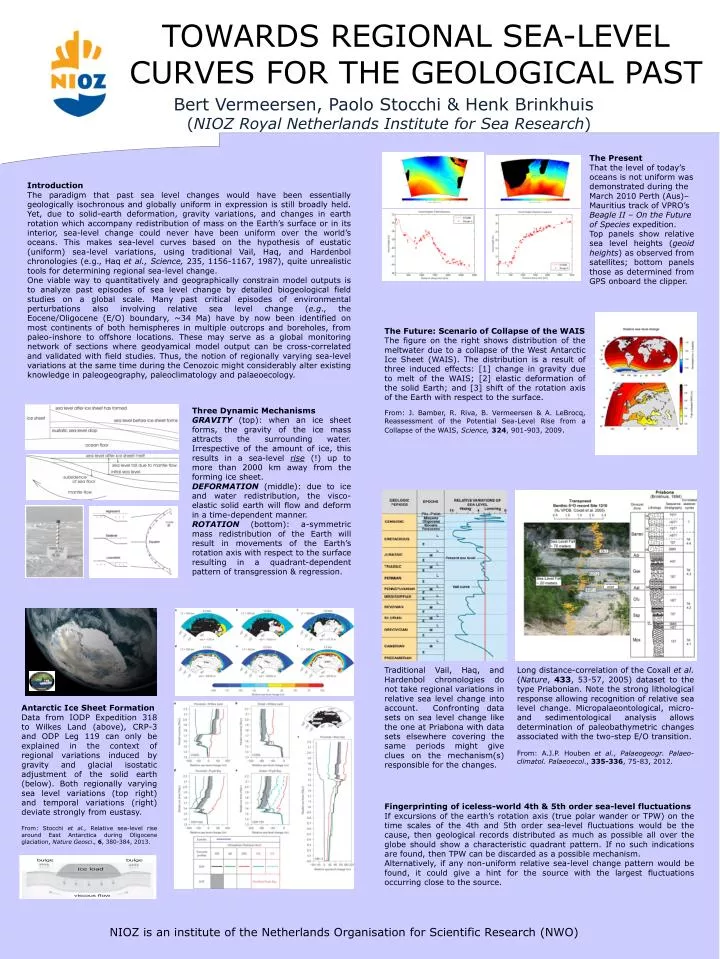
TOWARDS REGIONAL SEA-LEVEL CURVES FOR THE GEOLOGICAL PAST Bert Vermeersen, Paolo Stocchi & Henk Brinkhuis (NIOZ Royal Netherlands Institute for Sea Research) The Present That the level of today’soceans is not uniform was demonstratedduring the March 2010 Perth (Aus)– Mauritius track of VPRO’sBeagle II – On the Future of Species expedition. Top panels show relativesea level heights (geoidheights) as observedfromsatellites; bottom panels those as determinedfrom GPS onboard the clipper. Introduction The paradigm that past sea level changes would have been essentially geologically isochronous and globally uniform in expression is still broadly held. Yet, due to solid-earth deformation, gravity variations, and changes in earth rotation which accompany redistribution of mass on the Earth’s surface or in its interior, sea-level change could never have been uniform over the world’s oceans. This makes sea-level curves based on the hypothesis of eustatic (uniform) sea-level variations, using traditional Vail, Haq, and Hardenbol chronologies (e.g., Haqet al., Science, 235, 1156-1167, 1987), quite unrealistic tools for determining regional sea-level change. One viable way to quantitatively and geographically constrain model outputs is to analyze past episodes of sea level changeby detailed biogeological field studies on a global scale. Many past critical episodes of environmental perturbations also involving relative sea level change (e.g., the Eocene/Oligocene (E/O) boundary, ~34 Ma) have by now been identified on most continents of both hemispheres in multiple outcrops and boreholes, from paleo-inshore to offshore locations. These may serve as a global monitoring network of sections where geodyamicalmodel output can be cross-correlated and validated with field studies. Thus, the notion of regionally varying sea-level variations at the same time during the Cenozoic might considerably alter existing knowledge in paleogeography, paleoclimatology and palaeoecology. The Future: Scenario of Collapse of the WAIS The figure on the right shows distribution of the meltwaterdueto a collapse of the West Antarctic Ice Sheet (WAIS). The distribution is a result of threeinducedeffects: [1] change in gravityduetomelt of the WAIS; [2] elasticdeformation of the solid Earth; and [3] shift of the rotationaxis of the Earth with respect to the surface. From: J. Bamber, R. Riva, B. Vermeersen & A. LeBrocq, Reassessment of the Potential Sea-Level Rise from a Collapse of the WAIS, Science,324, 901-903, 2009. Three DynamicMechanisms GRAVITY (top): whenan ice sheet forms, the gravity of the ice massattracts the surrounding water. Irrespective of the amount of ice, thisresults in a sea-level rise (!) up to more than 2000 km awayfrom the forming ice sheet. DEFORMATION (middle): dueto ice and water redistribution, the visco-elasticsolidearthwill flow anddeform in a time-dependentmanner. ROTATION (bottom): a-symmetricmassredistribution of the Earth willresult in movements of the Earth’srotationaxiswith respect to the surfaceresulting in a quadrant-dependentpattern of transgression & regression. Traditional Vail, Haq, andHardenbolchronologies do not take regionalvariations in relativesea level change into account. Confronting data sets on sea level change like the one at Priabonawith data sets elsewherecovering the sameperiodsmightgiveclues on the mechanism(s) responsiblefor the changes. Long distance-correlation of the Coxallet al. (Nature, 433, 53-57, 2005) dataset to the type Priabonian. Note the strong lithological response allowingrecognition of relativesea level change. Micropalaeontological, micro- andsedimentological analysis allowsdetermination of paleobathymetricchanges associatedwith the two-step E/O transition. From: A.J.P. Houben et al., Palaeogeogr. Palaeo-climatol. Palaeoecol., 335-336, 75-83, 2012. Antarctic Ice Sheet Formation Data from IODP Expedition 318 to Wilkes Land (above), CRP-3 and ODP Leg 119 canonlybeexplained in the context of regionalvariationsinducedbygravityandglacialisostaticadjustmentof the solidearth (below). Both regionallyvaryingsea level variations (top right) andtemporalvariations (right) deviatestronglyfromeustasy. From: Stocchiet al., Relativesea-level risearound East Antarctica duringOligoceneglaciation, Nature Geosci., 6, 380-384, 2013. Fingerprinting of iceless-world 4th &5th order sea-level fluctuations If excursions of the earth’s rotation axis (true polar wander or TPW) on the time scales of the 4th and 5th order sea-level fluctuations would be the cause, then geological records distributed as much as possible all over the globe should show acharacteristic quadrant pattern. If no such indications are found, then TPW can be discarded as a possible mechanism. Alternatively, if any non-uniform relative sea-level change pattern would be found, it could give a hint for the source with the largest fluctuations occurring close to the source. NIOZ is an institute of the Netherlands Organisation for Scientific Research (NWO)