Download
1 / 27
270 likes | 482 Views
United States Department of Agriculture Food Safety and Inspection Service. Latent Risk Model. Latent Variable Model (most simple has only one latent variable- more than one latent variable can be modeled if necessary!)

E N D
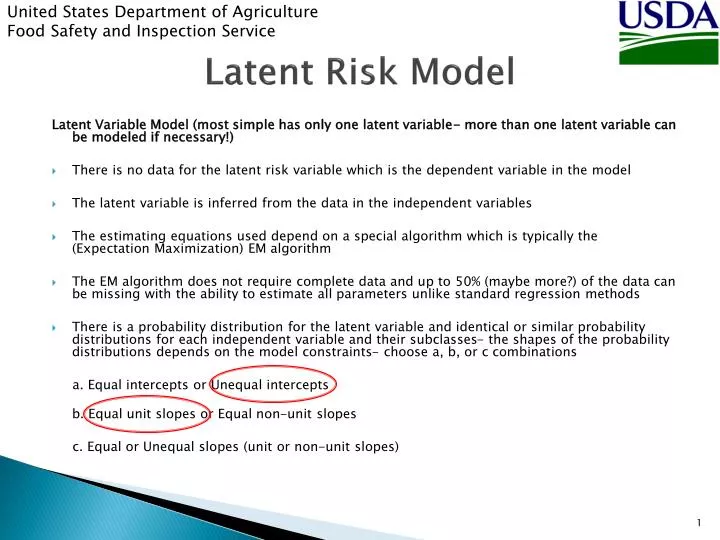
United States Department of Agriculture Food Safety and Inspection Service Latent Risk Model Latent Variable Model (most simple has only one latent variable- more than one latent variable can be modeled if necessary!) • There is no data for the latent risk variable which is the dependent variable in the model • The latent variable is inferred from the data in the independent variables • The estimating equations used depend on a special algorithm which is typically the (Expectation Maximization) EM algorithm • The EM algorithm does not require complete data and up to 50% (maybe more?) of the data can be missing with the ability to estimate all parameters unlike standard regression methods • There is a probability distribution for the latent variable and identical or similar probability distributions for each independent variable and their subclasses- the shapes of the probability distributions depends on the model constraints- choose a, b, or c combinations a. Equal intercepts or Unequal intercepts b. Equal unit slopes or Equal non-unit slopes c. Equal or Unequal slopes (unit or non-unit slopes)
United States Department of Agriculture Food Safety and Inspection Service Latent Risk Model Latent Variable Models we consider today • Latent variable has the cumulative logistic probability distribution (or equivalently the cumulative normal distribution or probit transformation) • Independent variables are quasi-independent for each other and each one at each categorical level has a cumulative logistic distribution • The particular form of the model used depends on if the data fit the simplest model or not- more complicated models with more parameters are used if the data does not fit the model- • Note: this is entirely different than fitting the model to the data which statisticians typically do by either simplifying the model (delete parameters or employ transformations, etc.) or moving on to other models with different probability distribution assumptions. • Here we evaluate if the data adequately fits the model we want to use- and use that model if the data adequately fits the model!
United States Department of Agriculture Food Safety and Inspection Service Latent Risk Model The Latent Risk Model is a Linear Model Y = m X + b, Y is dependent, X is independent, m is the slope and b is the intercept- the simplest model has all m’s equal to one Logit (Pji/Pji-1) = Xj + bi, there are j chemicals and i category levels of risk for each risk attribute, the bi’s are averaged over all chemicals because there is only one estimated risk level per chemical
For a 5 Point Likert Scale- There are 5 Probability Distributions, One for each of the Scale Categories
United States Department of Agriculture Food Safety and Inspection Service Chemical Residue Attributes FSIS Prioritization Criteria For Pesticides, Veterinary Drugs, and Environmental Contaminants EPA Prioritization Criteria For TSCA Work Plan Chemicals
United States Department of Agriculture Food Safety and Inspection Service 29 Chemical Attributes Evaluation
United States Department of Agriculture Food Safety and Inspection Service 312 Chemical Residues Evaluation
United States Department of Agriculture Food Safety and Inspection Service
Possible Two Dimensional Unconstrained Graded Risk Model for Data1- Chemical Risk vs. Economic Risk
Food Chemical Risk Data Sets General Rules for a data flat file • 1. Rows are unique to each chemical • 2. Columns refer to common risk factors • 3. Risk factors should directly relate to public health risk • 4. There are two relational tables • 5. The first table stores original data • 6. The second table lists column ranks to be used by the risk model • 7. All table entries must be linked to a bibliographical listing of each source
United States Department of Agriculture Food Safety and Inspection Service Chemical Residue Attributes FSIS Prioritization Criteria For Pesticides, Veterinary Drugs, and Environmental Contaminants EPA Prioritization Criteria For TSCA Work Plan Chemicals
Rows are Unique to each Chemical Row Names Excel Flat File
Columns Refer to Common Risk Factorsfor Each Food Chemical Residue • Column Names • 1ADI-Average Daily Intake ; these are labels for Risk Factor1-Risk Factor29 • 2Rfd-Reference Dose • 3MRL-Muscle • 4MRL-Liver • 5MRL-Kidney • 6MRL-Fat • 7MRL-Poultry • 8Water-sol • 9Partition • 10Half-life • 11Bone • 12Brain • 13Ear • 14Endocrine • 15Eye • 16GI • 17Heart-vess • 18Immune • 19Kidney • 20Liver • 21Lungs • 22Muscle • 23Nerves • 24Repro • 25Skin • 26Cancer • 27Cons-Muscle Level of Concern • 28Cons-Liver Level of Concern • 29Cons-Kidney Level of Concern • END NAMES ;this follows the item names: - the data follow: Column Names Excel Flat File
Risk Factors should Directly Relate to Public Health Food Chemical Risk In a multivariate Residue Risk Model • Risk Factor1 αPublic Health ChemFood Risk • Risk Factor2 αPublic Health ChemFood Risk • Risk Factor3 αPublic Health ChemFood Risk • Risk Factor4 αPublic Health ChemFood Risk • Etc. (Each with high correlation to overall risk) • Model (if we have a variable for the “latent” risk- but, we don’t- that’s why the overall risk is “latent” in the combined risk factors) • Latent Risk = a1Risk1+ a2Risk2+…+anRiskn
The second relational table lists column ranks to be used by the risk model
Coding Explained Raw Data for MRL Coding Scheme for MRL
Coding Explained Frequency Histograms Coding Scheme- Cancer
A Compressed Text File is created for use with Winsteps and Facets software (simplest models)
All Table Entries must be Linked to a Bibliographical Listing for each Source • Table 3. Tolerance Reassessment Summary for Aldicarb and Aldicarb Sulfone and Aldicarb Sulfoxide. Commodity Current Tolerance (ppm) Tolerance Reassessment (ppm) Comment/ [Correct Commodity Definition] • Tolerances Listed Under 40 CFR 180.269: • Barley, hay - 3.0 Rotational crop tolerances recommended by HED. • Barley, grain - 0.02 • Barley, straw - 0.1 • Beans (dry) 0.1 0.1 [bean, dry, seed] • Beets, sugar 0.05 0.05 [beet, sugar, roots] • Beets, sugar, tops 1 1 [beet, sugar, tops] • Cattle, fat 0.01 Revoke There is no reasonable expectation of finite residues. • Cattle, mbyp 0.01 • Cattle, meat 0.01 • Coffee beans 0.1 0.1 [coffee, green bean, import tolerance only] • Cottonseed 0.1 0.1 [cotton, undelinted seed] • Goats, fat 0.01 Revoke There is no reasonable expectation of finite residues. • Goats, mbyp 0.01 • Goats, meat 0.01 • Grapefruits 0.3 0.3 The registrant has proposed a crop group tolerance of 0.3 ppm for fruit, citrus, group. • Lemons 0.3 0.3 • Limes 0.3 0.3 • Oranges 0.3 0.3 • Hogs, fat 0.01 Revoke There is no reasonable expectation of finite residues. • Hogs, mbyp 0.01 • Hogs, meat 0.01 • Horses, fat 0.01 EPA 9/2007/Doc 7508p Excel Flat File
Control Text Files for Simple Models in Winsteps and Facets software • ***************************** 2,4-D • 44444444444433333444333553553 Abemectin • 44444422244242222522223542553 Acephate • ***4***5*4**5***454**434**444 Aldicarb • 4444454443333222344443*544555 Amitraz • ***22255533332222344433454444 Amitrole • ***55544433333333422222442552 Azinophos • ***4444444444***4444433444443 Bentazone • ***212343112211123*2211242321 Bifenithrin • ***************************** 4-aminopurine • ***44444422232212433333443443 2,4-DB • ***44444444433333333333333333 Acetochlor • ***555555******************** Acifluorofen • ***5554*45553***4455555545553 Alachlor • ***22233333311111111111131111 Allethrin • 44444444443231112442222444422 Aluminum Phosphide • ***55555544423333333333523543 Amitryn • 44444433333343314444444544544 Amitraz • 4555555554442***2533311552545 Amitrole • ***5554434444***4333344544554 Ammonium Sulfamate • 4444444444334322444333*443455 Atrazine • ***23444433333332333333333222 Azadirachtin • ***42244233323323133322242242 Azinophos-methyl • ***44443333323331333323543443 Beniocarb • ***33333322221112111122222434 Benomyl • ***4**44444433334444433443344 Bensulide • ***5554444444***3444433545555 Bentazon • ***344333333**323333343*33444 Bifenthrin • ***55555555555555555555555555 Bromacil • ***44544432233322443333443444 Bromoxynil • ***4334444333*333333323243233 Butylate • ***43355544433334433333554555 Cacodylic Acid • ***555*2233332222333323543542 Captafol • TITLE = 'Pesticide Data' • NI = 29 ; 29 items • ITEM1 = 1 ; responses start in column 1 of the data • NAME1 = 31 ; person-label starts in column 31 of the data • ITEM = Question ; items are called "questions" • PERSON= Chemical ; persons are called "chemical" • CODES = 12345 ; valid response codes (ratings) are 1, 2, 3, 4, 5 • CLFILE=* ; label the response categories • 1 High ; names of the response categories • 2 Mild • 3 Possible • 4 Unknown • 5 None • * ; "*" means missing • XWIDE = 1 ; number of columns per item response • UIMEAN = 0 ; item mean for local origin • USCALE = 1 ; user scaling for logits • UDECIM = 2 ; reported decimal places for user scaling • TOTAL = Yes ; show total raw scores • CHART = Yes ; produce across-pathway picture • MNSQ = No ; use Standardized fit statistics • &END ; this ends the control specifications • 1ADI ; these are labels for Q1-Q29 • 2Rfd • 3MRL-Muscle • 4MRL-Liver • 5MRL-Kidney • 6MRL-Fat • 7MRL-Poultry • 8Water-sol • 9Partition • 10Half-life • 11Bone • 12Brain • 13Ear • 14Endocrine • 15Eye • 16GI • 17Heart-vess • 18Immune • 19Kidney • 20Liver • 21Lungs • 22Muscle • 23Nerves • 24Repro • 25Skin • 26Cancer • 27Cons-Muscle • 28Cons-Liver • 29Cons-Kidney • END NAMES ;this follows the item names: - the data follow: Data (partial listing) Program Control Language
Excel Data files for Gradient Model and more complicated models in R