Download
1 / 1
10 likes | 160 Views
a. b. c. d. TK81-MS. TK81-MS. TK81-O. TK81-O. TK81-O. + - + -. + -. + -. + -. 1850. 1250. 710. 950. 750.

E N D
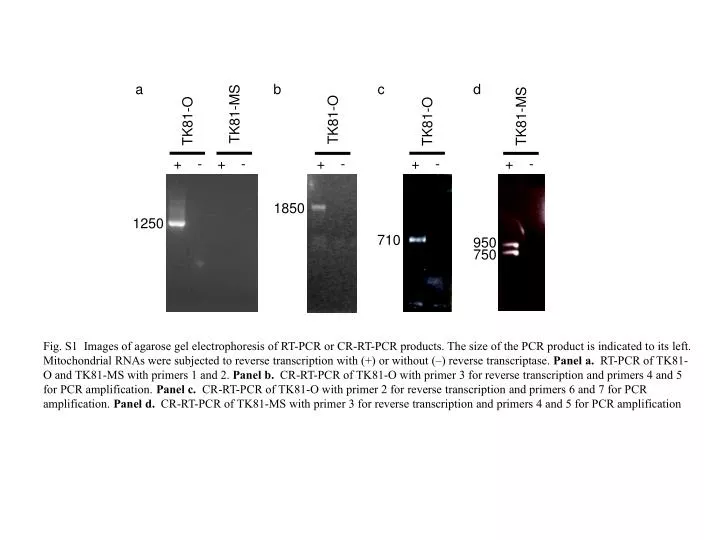
a b c d TK81-MS TK81-MS TK81-O TK81-O TK81-O + - + - + - + - + - 1850 1250 710 950 750 Fig. S1 Images of agarose gel electrophoresis of RT-PCR or CR-RT-PCR products. The size of the PCR product is indicated to its left. Mitochondrial RNAs were subjected to reverse transcription with (+) or without (–) reverse transcriptase. Panel a. RT-PCR of TK81-O and TK81-MS with primers 1 and 2. Panel b. CR-RT-PCR of TK81-O with primer 3 for reverse transcription and primers 4 and 5 for PCR amplification. Panel c. CR-RT-PCR of TK81-O with primer 2 for reverse transcription and primers 6 and 7 for PCR amplification. Panel d. CR-RT-PCR of TK81-MS with primer 3 for reverse transcription and primers 4 and 5 for PCR amplification