Download

1 / 32
320 likes | 428 Views
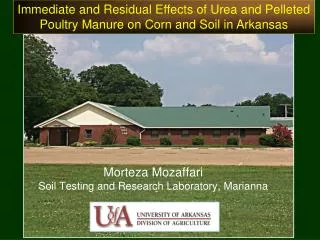
Efforts to Improve N Use Efficiency of Corn in Arkansas Highlights of Research in Progress. Morteza Mozaffari Soil Testing and Research Laboratory, Marianna. Acknowledgement. Research was funded by Arkansas Corn and Grain Sorghum Promotion Board. Presentation outline. Backgrounds Information

E N D
Efforts to Improve N Use Efficiency of Corn in Arkansas Highlights ofResearch in Progress Morteza MozaffariSoil Testing and Research Laboratory, Marianna
Acknowledgement Research was funded by Arkansas Corn and Grain Sorghum Promotion Board
Presentation outline • Backgrounds Information • Presidedress soil nitrate test (PSNT) • Using chlorophyll meters
Mississippi Delta Region of Arkansas (MDRA) • MS River Delta Region of Arkansas • Soils: predominantly alluvial • Topography: relatively flat land • One of the oldest row crop production regions
Corn Production in Arkansas Acres Planted X 1000 YEAR
Urea Price $ / Ton YEAR
Long-term sustainability of corn production Profit margin Protect water quality
Presentation outline • Backgrounds Information • Presidedress soil nitrate test (PSNT) • Using a chlorophyll meter
The PSNT idea • Apply a small amount of N (30-40 lb/acre) at planting • Collect a soil sample from 0-12” depth at 6-8-leaf stage • Use the PSNT result as a guide to identify and apply the optimum N rate
Objectives For irrigated corn production in MRDRA • Evaluate the effect of sidedress N-fertilizer rate on corn grain yield • Assess the suitability of PSNT for improving corn N fertility management
21 replicated field experiments • Production fields and AES sites across the MRDRA • 04-07 • Experimental Design: • Randomized complete block with4-5 replications • Five or six N rates • Total N rates:0-300 lb N/acre • Year 1 and 2: 0, 50, 100, 150, 200, and 300 lb N/acre • Year 3: 0, 60, 120, 180, 240 300 lb N/acre • Cultural Practices: • AES Sites: Cooperative Extension Service recommendations • Commercial sites: Growers’ Practices Research Approach
Research Approach • Important dates: • planted: 17 March to 4 June • sidedress N date: 4 May to 6 June (6-8 leaf stage) • harvest: 10 Aug to Sep 18 • Soilsampling and analysis: • pre plant, top 6”, six cores/replication • measured NO3-N, pH, texture, Mehlich-3 nutrients • PSNT samples 6-8 leaf (before 2nd N application) • zero to 12’’, six cores, 0 N plots • measured NO3-N by ISE
Data Analysis • Analysis of Variance: • to evaluate the effect of N rate on grain yield • sites were analyzed separately • Calculated Relative Yield as: • (check plot yield/highest plot yield) X 100
Properties of soil samples collected from the 0-6” depth before planting
Summary of the Results • PSNT (mg/kg): • 4-36: all sites • 4-10: 12 sites • 10-20: 5 sites • > 20: 4 sites • Grain yield: • Significant N response: 20 sites, P≤0.0003 • Zero N treatments: 9-192 (bu/acre) • Highest N rate: 140-223 (bu/acre) • State average: 131-146 (bu/acre) • Agronomic Optimum N rate: • 150-250 (lb/acre)
Correlation between PSNT and relative yield of the check plot (All 21 sites) Relative yield (%) PSNT (ppm)
Correlation between PSNT and relative yield of the check plot (sandy loam and silt loam sites, 16 sites) Relative yield (%) PSNT (ppm)
Conclusions of PSNT Study In irrigated corn production in MRDRA • Sidedress application of N significantly increased corn grain yield in 20 of the 21 sites • Agronomic Optimum N rate was 150-250 lb/acre • Presidedress soil nitrate test shows great promise for improving corn N fertility management
Presentation outline • Backgrounds Information • Presidedress soil nitrate test • Using a chlorophyll meter
Basic Idea • Establish a well fertilized N reference strip in your field • Collect chlorophyll meter reading from plants in area you may want to fertilize • Collect chlorophyll meter reading from your reference strip • Calculate relative chlorophyll meter value (RCM) • CM reading from are you want to fertilizeRCM = • CM reading from the reference area 34.6 RCM= 58.0 = 0.59
Research Approach • 5 replicated field experiments • Production fields and AES sites across the MRDRA • 07 • Experimental Design: • Randomized complete block with4-5 replications • N fertilizer management: • Five N rates 0, 60, 120, 180, 240 300 lb N/acre • Split N application: preplant and four leaf stage • Cultural Practices: • AES Sites: Cooperative Extension Service recommendations • Commercial sites: Growers’ Practices
Research Approach • Important dates: • planted: 4 April to May 5 • harvest: 15 Aug to Sep 17 • Soilsampling and analysis: • pre plant, top 6”, six cores/replication • measured NO3-N, pH, texture, Mehlich-3 nutrients • Leaf and CM data collection: • 9-12 leaf stage
Data Analysis • Analysis of Variance: • to evaluate the effect of N rate on grain yield, leaf N, and CM • sites were analyzed separately • Calculated Relative Yield and Relative CM
Properties of soil samples collected from the 0-6” depth before planting
Summary of the Results • Grain yield: • Significant N response: all sites, P≤0.0044 • Zero N treatments: 31-178 (bu/acre) • Highest N rate: 131-233 (bu/acre) • State average: 148 (bu/acre)
Correlation between RCM and relative yield at five sites Relative yield (%) PSNT (ppm)
Concluding Remarks • PSNT and CM are promising tools for Improving N use efficiency in Arkansas • Additional work is underway