Download
1 / 31
310 likes | 379 Views
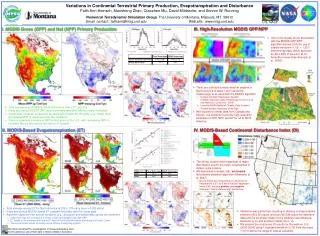
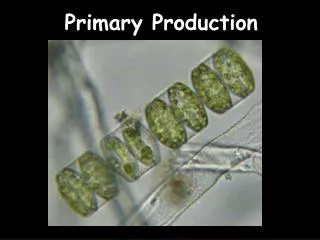
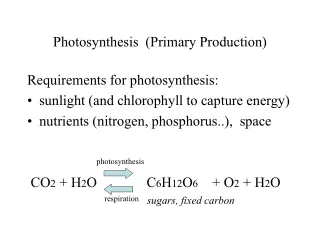
Gross Primary Production. Net photosynthesis at the ecosystem scale is GPP = Carbon Input to Ecosystems. = Sum of Ps over space and time. Levels of control Controls in individual leaves Control by canopy processes Controlling factors Direct controls: CO 2, light

E N D
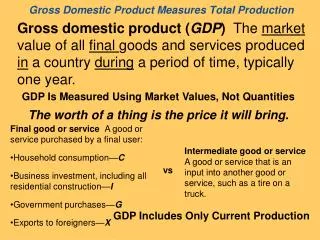
Gross Primary Production • Net photosynthesis at the ecosystem scale is GPP = Carbon Input to Ecosystems = Sum of Ps over space and time • Levels of control • Controls in individual leaves • Control by canopy processes • Controlling factors • Direct controls: CO2, light • Indirect controls: water, nutrients, temperature
Do factors affecting leaf level Ps explain variation in GPP among ecosystems? Are the controls over leaf- and canopy-level Ps the same?
CO2 • Water • Light • Nitrogen • [Temperature-modulator] Limitation Plants adjust components of Ps so physical and biochemical processes co-limit C fixation Plants adjust resource acquisition to maximize capture of the most limiting resource Acclimation versus adaptation!
Ecosystem GPP differs from leaf Ps Broader range of light levels where LUE is constant
Canopy processes Multiple species
Canopy processes • Leaves fill a 3-D space. Leaf area index (LAI) measured in m leaf/ m ground (LAI ≈ 3 in closed canopy forests) • Clumping canopy leaves, angled relative to sun, allows light to leaves lower down in canopy. Most GPP at top. • Canopy roughness allows CO2 to mix with free troposphere, reducing diffusional limitation. • When water is sufficient, moderate wind has a positive effect on Ps
Controls over GPP • Ecosystem differences are determined primarily by LAI and by length of growing season • LAI is determined by soil resource supply (water, nutrients), but disturbances (fire, wind), herbivory, pathogens can further reduce LAI • Within ecosystems and growing seasons, controls are the environmental controls over Ps (1=PAR, CO2, 2 =H2O, N), similar to individual leaves.
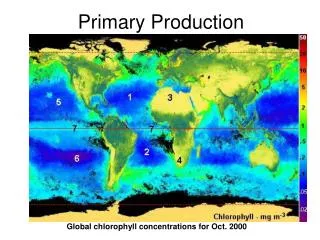
GPP estimated from satellites (NIR-VIS) NDVI = (NIR+VIS) NDVI: Normalized difference vegetation index NIR: % Near-infrared radiation reflected VIS: % Visible radiation reflected Leaf area reflects NIR (Hi lvs, big #) Chlorophyll absorbs VIS (Hi lvs, small #) 0 = no vegetation, ~1 = high productivity
http://landweb.nascom.nasa.gov/animation/images/samples/MOD13A2.NDVI.2003.004.8FS.gifhttp://landweb.nascom.nasa.gov/animation/images/samples/MOD13A2.NDVI.2003.004.8FS.gif
Net Primary Productivity NPP = GPP - Respirationplant ≈50% of GPP is used for respiration
Net Primary Productivity NPP = GPP - Respirationplant Three components of respiration: Growth (~25+%) -- synthesis of cellulose, proteins, lipids, etc. Ion uptake (~25+%) -- energy for nutrient uptake from soil and transport of ions across membranes (25-50% of root respiration) Maintenance respiration (~50%) –repair of membranes, proteins, other
Factors controlling respiration NPP = GPP - Respirationplant 1. Tissue N -- protein turnover; 6% replaced daily; 85% of maintence respiration Temperature -- increased protein and membrane turnover at higher temperatures GPP and Rplant generally related, so NPP and GPP are proportional However, at hot temperatures, Ps may be maintained or inhibited, while Rplant increases. NPP/GPP decreases.
NPP operationally defined Aboveground: Aboveground biomass increment* Fine litterfall* Losses to consumers Volatile and leached organics (VOC, DOC) Belowground: Root biomass increment* Dead roots* Losses to consumers Root exudates & export to symbionts
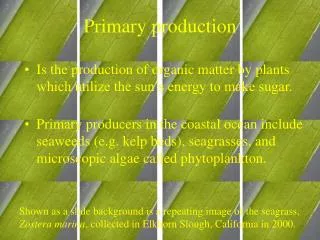
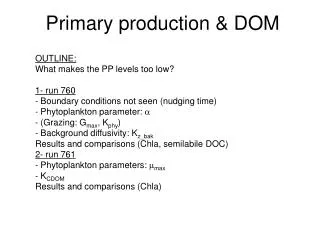
Belowground NPP • Sequential coring – measure root mass in cores over fairly short time intervals (monthly), to minimize underestimates due to turnover •Ingrowth cores – measure growth of new roots into ‘empty’ soil, also at short time intervals •Minirhizotron observations – take frequent pictures of live, growing, and senescing roots using belowground cameras. Convert images (root length or area) to productivity (g m-2 d-1).
Camera The minirhizotron technique for measuring root productivity Image of roots and root hairs (wheat grown in a sandy soil) Minrhizotron tube
Example of software used to convert images to productivity(typically length of root per cm2 viewing area per day)… Additional challenge: convert these units to NPP (g m-2 ground area yr-1)
Minirhizotron observationsprovide a window into belowground biology…
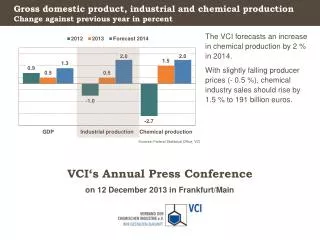
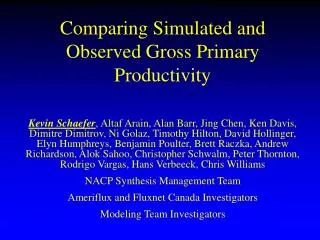
25 ¡ 20 Mg C ha-1 yr -1 ¡ ¡ ¡ 15 ¡ ú ¡ ¡ ¡ ¡ ú ú ¡ ú ¡ ú ¡ ¡ ¡ ¡ ú ¡ ¡ 10 ¡ ¡ l ú l ¡ ¡ ¡ ¡ ¡ ¡ l ú ¡ ¡ l ú ú ú ¡ ¡ ú ú ú ¡ ú ¡ ¡ ¡ ú ú l ú ú ¡ ú ú ¡ ú ú ¡ ú ú ú 5 ú ú ¡ ú ú ú ú ú ú l ú ú ú ú ú ú ¡ ú ú ú ¡ ú ú ú ú ú ú ú ú 0 0 2000 4000 6000 8000 Mean Annual Precipitation (mm) Climate controls over NPP • At a global scale, NPP is strongly correlated with ppt and T • Water increases plant growth in drier ecosystems. Also increases decomposition and nutrient cycling. • In very wet ecosystems, ppt can limit NPP by decreasing light or nutrient availability
Climate controls over NPP 25 ¡ 20 Mg C ha-1 yr -1 ¡ ¡ ¡ 15 ¡ ¡ ¡ ¡ ú ¡ ú ¡ ú ú ¡ ¡ ú ¡ ¡ ¡ 10 ¡ ¡ ú l l ¡ ¡ ¡ ¡ ¡ l ú ¡ ¡ l ú ú ú ú ¡ ¡ ú ú ¡ ¡ ¡ ¡ ú ú ú l ú ú ¡ ú ú ¡ 5 ú ú ú ú ú ¡ ú ú ú ú ú ú ú l ú ú ú ú ¡ ú ú ¡ ú ú 0 -15 -10 -5 0 5 10 15 20 25 30 Mean Annual Temperature (ºC) • Temperature is related to growing season length • Temperature stimulates decomposition and nutrient cycling.
25 ¡ 20 Mg C ha-1 yr -1 ¡ ¡ ¡ 15 ¡ ú ¡ ¡ ¡ ¡ ú ú ¡ ú ¡ ú ¡ ¡ ¡ ¡ ú ¡ ¡ 10 ¡ ¡ l ú l ¡ ¡ ¡ ¡ ¡ ¡ l ú ¡ ¡ l ú ú ú ¡ ¡ ú ú ú ¡ ú ¡ ¡ ¡ ú ú l ú ú ¡ ú ú ¡ ú ú ¡ ú ú ú 5 ú ú 25 ¡ ú ú ú ú ú ¡ ú l ú ú ú ú ú ú ¡ ú ú ú ¡ ú ú ú ú ú ú ú ú 0 20 0 2000 4000 6000 8000 Mean Annual Precipitation (mm) Mg C ha-1 yr -1 ¡ ¡ ¡ 15 ¡ ¡ ¡ ¡ ú ¡ ú ¡ ú ú ¡ ¡ ú ¡ ¡ ¡ 10 ¡ ¡ ú l l ¡ ¡ ¡ ¡ ¡ l ú ¡ ¡ l ú ú ú ú ¡ ¡ ú ú ¡ ¡ ¡ ¡ ú ú ú l ú ú ¡ ú ú ¡ 5 ú ú ú ú ú ¡ ú ú ú ú ú ú ú l ú ú ú ú ¡ ú ú ¡ ú ú 0 -15 -10 -5 0 5 10 15 20 25 30 Mean Annual Temperature (ºC) Climate controls over NPP In ecosystems where correlations suggest a strong climatic limitation of NPP, experiments and observations indicate that this is mediated primarily by climatic effects on belowground resources.
Resource control • Proximate control over NPP is availability of resouces • Light, CO2,H2O, nutrients (N,P,K,Mg,Ca,…) • Many ecosystems increase NPP when N or P fertilizer is added. • Some ecosystems increase NPP when CO2 or H2O is added. • Where T has been manipulated, NPP doesn’t respond directly.
Leibig (1840’s) "Father of physiological ecology” studied mineral elements added to plant soil Law of the Minimum When the rate of a process is controlled by a number of separate factors, the rate is limited by the pace of the 'slowest' or most limiting factor. Limiting Factor The simplest idea is that growth is limited by a single resource. But, often more than one factor might increase NPP (e.g., water and nutrients)
Multiple resource limitation 1.Plants adjust resource acquisition to maximize capture of most limiting resource 2.Changes in the environment alter the relative abundance of resources. Different factors limit NPP at different times 3.Plants exhibit mechanisms that increase the supply of the most limiting resource 4.Different resources limit different species in an ecosystem.
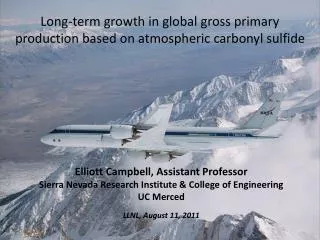
Global Potential Net Primary Productivity Mg C ha -1 yr-1
Biome Differences in NPP (Terrestrial) • Length of the growing season is the major factor that explains biome differences in NPP • Differences in leaf area account for most of the variation in biome NPP within a growing season • Leaf area, in turn, is determined by soil resources, climate, and time since disturbance • Disturbance substantially modifies the relationship between NPP and climate