Download
1 / 25
250 likes | 342 Views
2008-2009. AYP & API Results. <Add Site/District Name>. Assessment Literacy. Adequate Yearly Progress (AYP). and. Academic Performance Index (API). AYP. Student Achievement Measurements. Federal: (NCLB) No Child Left Behind of 2001. State: (PSAA)

E N D
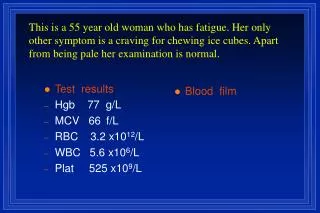
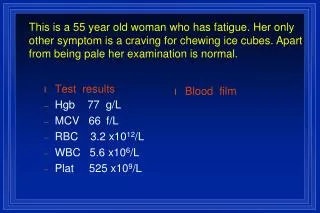
2008-2009 AYP & API Results <Add Site/District Name>
Assessment Literacy Adequate Yearly Progress (AYP) and Academic Performance Index (API)
AYP Student Achievement Measurements Federal: (NCLB) No Child Left Behind of 2001 State: (PSAA) Public Schools AccountabilityAct of 1999 Academic Performance Index Adequate Yearly Progress (Performance Bands) (Proficient or Non Proficient) Status Bar Model School’s goal is to meet performance targets! Improvement Model School’s goal is to make incremental improvement! HO
Subgroups (Ethnic and Racial) • White • Hispanic • African American • Filipino • Asian • Pacific Islander • Other • Socioeconomic Disadvantaged • English Language Learners • Students with Disabilities AYP and API Define Subgroups • API = Academic Performance Index • How much a school is improvingyear to • year based on its growth target. • Target = 800 If less, school must meet annual target • All subgroups do not need to meet for school to pass. Understanding AYP & API • AYP = Adequate Yearly Progress • How well schools are meeting common • standards of academic performance • Target = AMO - % of students proficient • School and subgroups must meet for school to pass
Meet minimum % proficient or advanced inELA & Math Meet minimum graduation rate orgrowth of one-tenth of 1%* 95% or greater participation inELA & Mathassessment* Meet minimum APIorgrowth of 1 Point * OR average of two-tenths of 2% over 2 years * OR Two - or Three-year averaging Four Criteria For Making AYP Adequate Yearly Progress(AYP) Annual Measurable Objective (AMO) Participation Rate Academic Performance Index (API) Graduation Rate Adapted from CCSSESA/CISC Training Series for COE
AYP Adequate Yearly Progress Federal: (NCLB) No Child Left Behind of 2001 (Proficient or Non Proficient) Status Bar Model School’s goal is to meet performance targets!
1) AMO Trends 3) Gap Analysis 2) Participation Rate
1) AMO Trends 3) Gap Analysis 2) Participation Rate
Title I missed for 2yrs: • same Independent Indicator • AYP in the same content area and in each grade span • (2-5, 6-8 and grade 10) • AYP = Adequate Yearly Progress • How well schools are meeting common • standards of academic performance • Target = AMO - % of students proficient • School and subgroups must meet for school to pass • API = Academic Performance Index • How much a school is improvingyear to • year based on its growth target. • Target = 800 If less, school must meet annual target • All subgroups do not need to meet for school to pass. 6) PI Status 4) Independent Indicators Trends 5) AYP Trend
Activity Overview • What do you know as a result of examining the data? (# tested, % proficient,Participation Rate, Graduation Rate, Met AYP, …) • What do you think (hunches) as a result of examining the data? (Programs,focus areas, changes …) • What else do you want to know as a result of examining the data? (Attendance Rate,Gender, …) • How can we use the data?
7-Minute TurboMeeting Identifying Patterns & Trends Instructions: 2 Min. – On post-it write what you see, I statements per post-it 3 Min. - Place post-its in center of table and share with others 2 Min. - Organize/summarize & chart group findings (post on wall) Accept everything, No evaluation & Think out of the box
7-Minute TurboMeeting Hunches (Why?) Instructions: 1 Min. - On 3X5 card write your hunches (Individual) 4 Min. - Share hunches and record group hunches 2 Min. - What else does your group want to know? Accept everything, No evaluation & Think out of the box
Now What? • Now discuss how this data can be used
A P I State: (PSAA) Public Schools AccountabilityAct of 1999 Academic Performance Index Improvement Model School’s goal is to make incremental improvement!
A P I API Growth Across Years Why is it inappropriate to compare API growth scores across years?
API: Transition between Years • From one year to the next, state assessments may be added or taken away from the indicators used for calculating the API. • In the 2006–07 API cycle, newly added tests include Grade Eight science, Grade Ten Life Science, and CAHSEE for Grade Twelve. • The weighting or emphasis of each test also can change. • The weighting of the assignment of 200 for high school mathematics and science also changed.
Past Changes to the API Indicators … … Elementary & Middle Schools High Schools Check weights at: http://www.cde.ca.gov/ta/ac/ap/index.asp
3) Gap Analysis 4) Projected Outcomes
Activity Overview • What do you know as a result of examining the data? (Base, Growth API, Growth, & # tested, % proficient,Participation Rate, Graduation Rate, Met AYP, …) • What do you think (hunches) as a result of examining the data? (Programs,focus areas, changes …) • What else do you want to know as a result of examining the data? (Attendance Rate,Gender, …) • How can we use the data?
Thank You! APR Site: http://data.ctap10.org APR CD PC: http://ctap10.org/APR09.zip MAC: http://ctap10.org/APR_Reports.zip Contact: Becky Sumbera, bsumbera@ctap10.org Robert Daeley, rdaeley@ctap10.org