Download
1 / 43
430 likes | 485 Views
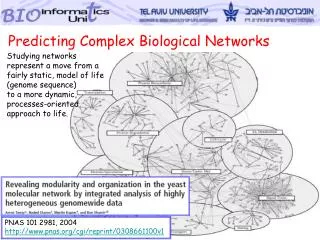
An indicator-based characterization of PNAS. Kevin W. Boyack Sandia National Laboratories Sackler Colloquium on Mapping Knowledge Domains May 11, 2003.

E N D
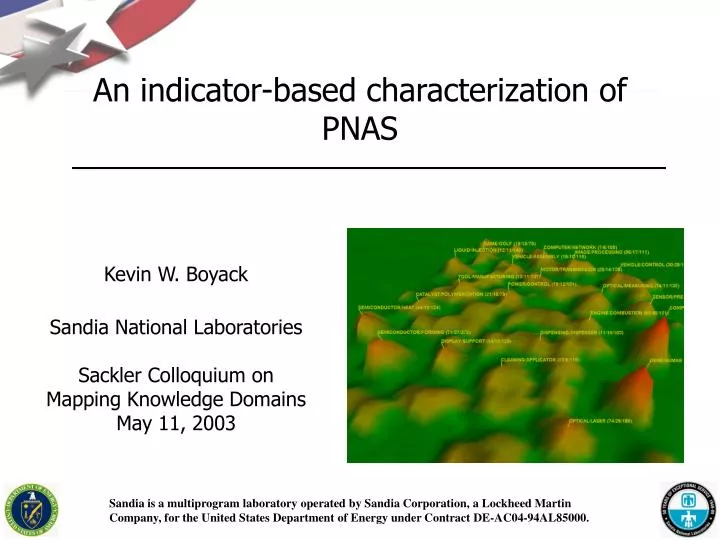
An indicator-based characterization of PNAS Kevin W. Boyack Sandia National Laboratories Sackler Colloquium on Mapping Knowledge Domains May 11, 2003 Sandia is a multiprogram laboratory operated by Sandia Corporation, a Lockheed Martin Company, for the United States Department of Energy under Contract DE-AC04-94AL85000.
Outline • Data sources • Impact vs. funding • Map of highest impact work • Topics and Import-Export • Bibliographic coupling and external references
Indicators • Lots of work by NSF, OECD • Many ways of counting • Often slanted to economic • Not often directly correlating inputs and outputs • Rarely taking any firm stand • Some studies relating funding and impact • Most recent from Britain or Australia (biomed) • Few large scale import-export studies
Data Sources • Used ISI/SCIE data as base set • Used only articles, letters, notes, reviews (ALNR) • Did not include commentaries, editorials, corrections • Medline for MeSH terms • NIA grants (dollar amounts, durations, etc.) • PNAS full text (not used) • PNAS tables of contents (topics)
NIA GRANTS YEAR PI INST FUNDING -Amounts -Durations ISI/SCIE VOL PAGE YEAR AUTHOR INST REFERENCES COUNTS MEDLINE VOL PAGE MeSH -Funding type -Descriptors PNAS TOC VOL PAGE TOPICS Data Merges
Percentiles vs. Counts • This study uses percentiles exclusively rather than citation counts • Percentiles enables cross-year comparisons • Only 30-40% of papers have more citations than the mean • Calculation of percentiles • Papers ranked for each year by citation count • Rankings converted into percentiles
Funding and Impact • Effect of funding type • Effect of funding amount
MeSH Support Types • Support, U.S. Gov't, P.H.S. • NIH • Support, U.S. Gov't, Non-P.H.S. • All other US agencies (NSF, DOE, DOD, etc.) • Support, Non-U.S. Gov't • US non-government (academia, industry …) • Foreign
Matching Papers to Grants • PNAS author = Grant PI (last name + first initial)AND • PNAS author institution = Grant PI institutionAND • PNAS publication year >= Grant initial yearAND • PNAS publication year <= Grant initial year + 5ORPNAS publication year <= Grant final year + 2
Map of Highest Impact Papers • Used top quartile of cited docs per year • Number of citations as of 12/31/2002 • Citation based map • Direct and bibliographic coupling • Henry Small’s combined linkage formula • Direct weight of 5 (rather than Small’s 2) • Outer references included • Divided into 70 clusters • Shift in content over time
BIOLOGICAL SCIENCES Agricultural Sciences Applied Biological Sciences Biochemistry Biophysics Cell Biology Developmental Biology Ecology Evolution Genetics Immunology Medical Sciences Microbiology Neurobiology Pharmacology Physiology Plant Biology Population Biology Psychology PHYSICAL SCIENCES Applied Mathematics Applied Physical Sciences Astronomy Chemistry Computer Sciences Engineering Geology Geophysics Mathematics Physics Statistics SOCIAL SCIENCES Anthropology Economic Sciences Psychology Social Sciences PNAS Topics
More Fun • Looking for a better way to show evolution of science over time periods • Should show splitting, joining of clusters, rather than the more continuous evolution that our current techniques show • Map short time periods (e.g. 2 years) with overlaps and use overlaps to join maps
Big Change in Clusters with One Year 1997-1998 1996-1997
Another Example (3 Year Change) 2000-2001 1997-1998
Distribution of References Top references 3194 Laemmli UK (1970), Nature 227, 680. 2876 Maniatis T (1982), Mol Cloning Laboratory. 2659 Sanger F (1977), P Natl Acad Sci USA 74, 5463. 2364 Sambrook J (1989), Mol Cloning Laboratory. 1149 Chirgwin JM (1979), Biochemistry-US 18, 5294. 1121 Lowry OH (1951), J Biol Chem 193, 265. 1051 Bradford MM (1976), Anal Biochem 72, 248. 1050 Maxam AM (1980), Method Enzymol 65, 499. 968 Southern EM (1975), J Mol Biol 98, 503. 951 Towbin H (1979), P Natl Acad Sci USA 76, 4350. 900 Chomczynski P (1987), Anal Biochem 162, 156. 787 Feinberg AP (1983), Anal Biochem 132, 6. 588 Rigby PWJ (1977), J Mol Biol 113, 237. 579 Thomas PS (1980), P Nat Acad Sci US-B 77, 5201. 575 Miller JH (1972), Expt Mol Genetics.
Distribution of References Top references 3194 Laemmli UK (1970), Nature 227, 680. 2876 Maniatis T (1982), Mol Cloning Laboratory. 2659 Sanger F (1977), P Natl Acad Sci USA 74, 5463. 2364 Sambrook J (1989), Mol Cloning Laboratory. 1149 Chirgwin JM (1979), Biochemistry-US 18, 5294. 1121 Lowry OH (1951), J Biol Chem 193, 265. 1051 Bradford MM (1976), Anal Biochem 72, 248. 1050 Maxam AM (1980), Method Enzymol 65, 499. 968 Southern EM (1975), J Mol Biol 98, 503. 951 Towbin H (1979), P Natl Acad Sci USA 76, 4350. 900 Chomczynski P (1987), Anal Biochem 162, 156. 787 Feinberg AP (1983), Anal Biochem 132, 6. 588 Rigby PWJ (1977), J Mol Biol 113, 237. 579 Thomas PS (1980), P Nat Acad Sci US-B 77, 5201. 575 Miller JH (1972), Expt Mol Genetics.
Few References Account for Tail 31 references removed All references
Questions and Things to Do • How to best show the real evolution of science? • Does this indicate a lack of a new biomedical revolution to drive the next generation research? • Compare coupling distributions of PNAS to other journals