Download
1 / 16
160 likes | 375 Views
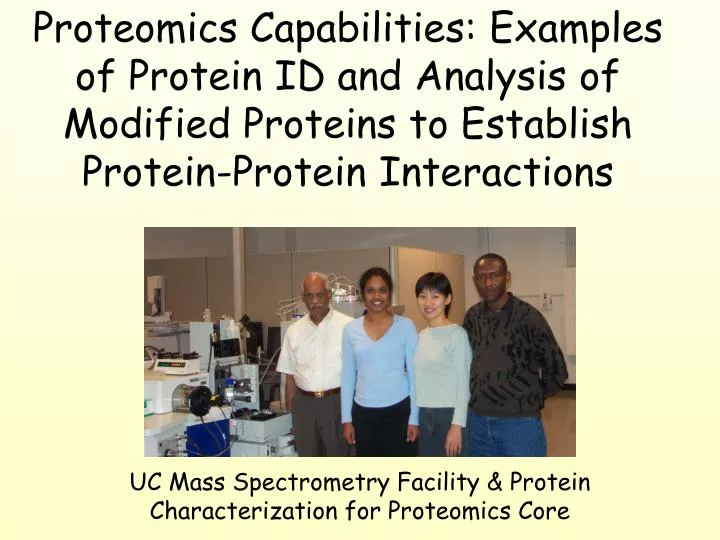
Proteomics Capabilities: Examples of Protein ID and Analysis of Modified Proteins to Establish Protein-Protein Interactions. UC Mass Spectrometry Facility & Protein Characterization for Proteomics Core. Protein Identification. 2-D gel with spots to be analyzed. 1. 2. 3. 4. 6. 5. 7.

E N D
Proteomics Capabilities: Examples of Protein ID and Analysis of Modified Proteins to Establish Protein-Protein Interactions UC Mass Spectrometry Facility & Protein Characterization for Proteomics Core
Protein Identification 2-D gel with spots to be analyzed 1 2 3 4 6 5 7 Expanded view of spots 1 & 2 Excised gel spots are submitted to MSF for analysis. After proteolysis, liquid chromatography tandem mass spectrometry (LC-MS/MS) is done.
Protein Identification After LC-MS/MS, the data file is searched against a protein database. Significant protein matches (outside the green shaded box) are identified based on the quality of the peptide sequences obtained by LC-MS/MS. The list of significant matches are then reported back to the investigator.
Protein Identification Facility personnel verify protein assignments by examining quality of underlying sequence data. Primary data is also archived and can be re-examined upon investigator request.
Protein Identification For Protein Identification of gel spots: More sample submitted yields higher quality results Some samples may contain mixtures of proteins
Protein Identification In addition to protein identification from gel spots, mixtures of proteins (e.g., pulldowns) can be analyzed in a similar fashion. In this case, a combination of data reduction approaches are used to generate protein identifications. Initial level - database search Second level - de novo sequencing and BLAST search For this example, nearly 30 unique proteins were identified from an investigator supplied protein mixture.
Modified Proteins The mass spec process for characterizing protein modifications is significantly different than that used for protein identification. There are three keys to success: 1. Availability of pure control and modified protein in reasonable abundance 2. Availability of control protein sequence 3. High sequence coverage in the MS analysis Case study #1: Protein-Protein interactions among three extrinsic membrane proteins
Modified Proteins Modified Control TIC MS/MS Scan TIC MS/MS Scan TIC MS Scan TIC MS Scan The first step in the process is to obtain as much MS and MS/MS information from the control and modified protein as possible.
Modified Proteins 17 kDa extrinsic membrane protein 1 EARPIVVGPPPPLSGGLPGTENSDQ ARDGTLPYTKDRFYLQPLPPTEAAQ 51 RAKVSASEILNVKQFIDRKAWPSLQ 76 NDLRLRASYLRYDLKTVISAKPKDE 101 KKSLQELTSKLFSSIDNLDHAAKIK 126 SPTEAEKYYGQTVSNINEVLAKLG Among the approaches for increasing sequencing coverage are the use of multiple proteases and/or variation in the MS experimental conditions. When completed, nearly 350 peptide sequences needed to be evaluated for this 17 kDa protein.
Modified Proteins Next, a database of potential modified peptides is generated to be used for searching of experimental data
Modified Proteins A list of potentially modified peptides is generated after the database search; initial evaluation of likelihood of modification is then made (similar to MALDI-based MS methods). 1 EARPIVVGPPPPLSGGLPGTENSDQ ARDGTLPYTKDRFYLQPLPPTEAAQ 51 RAKVSASEILNVKQFIDRKAWPSLQ 76 NDLRLRASYLRYDLKTVISAKPKDE 101 KKSLQELTSKLFSSIDNLDHAAKIK 126 SPTEAEKYYGQTVSNINEVLAKLG
Modified Proteins All potentially modified peptides are then de novo sequenced to determine whether modification site can be seen from the sequence data.
Modified Proteins K + biotin Query – 973.01,+2 Sequence determined – (54)VSASEILNVKQFIDR(68) Several software programs are used for de novo sequencing. For the 973.01 ion, a biotinylated residue at K63 was found. Site of modification is determined by the 226 Da mass shift of the y6 peptide fragment ion.
Modified Proteins Query – 785.42,+2 No sequence determined Although the initial mapping data may suggest possibility of modification, in some cases insufficient sequence information is available to confirm possibility. Analysis of other LC-MS/MS runs is then required.
Modified Proteins Characterization of Modified Proteins: 1. LC-MS/MS of control sample Optimize chromatographic & mass spectrometric conditionsDetermine sequence coverageEstablish protein database (when necessary) 2. Generate database of potential modification sites 3. LC-MS/MS of modified sample Compare LC-MS information to generated database values; identify potential modified peptides De novo sequencing of potential modified peptides Verify assignments or retrieve additional information with other proteolytic digestions
Modified Proteins MS Facility Helpful Hints: Purify at least 1 µg control and 1 µg modified protein Be specific about the information desired (e.g., number of modification sites; specific sites of modification; possibility of undermodification) Be patient – characterization of modified proteins is not a short turn-around time analysis Contact Dr. Macha (6-1575) beforehand for guidance and facility backlog information