Download
1 / 20
210 likes | 356 Views
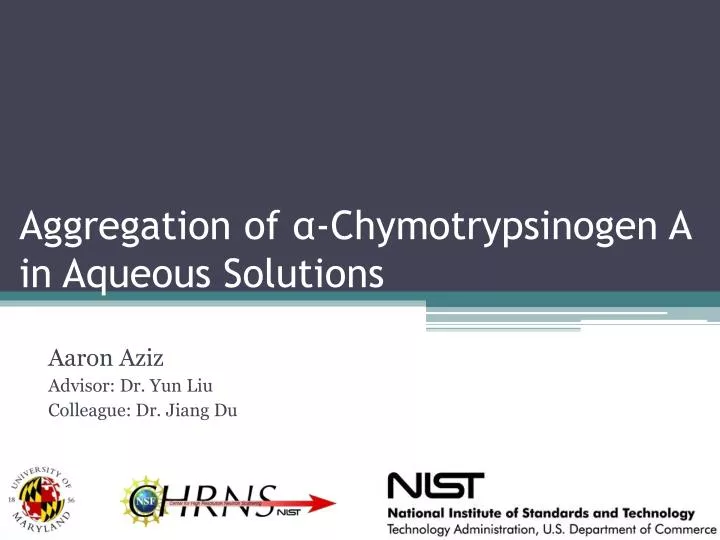
Aggregation of α -Chymotrypsinogen A in Aqueous Solutions. Aaron Aziz Advisor: Dr. Yun Liu Colleague: Dr. Jiang Du. What is Protein Aggregation?. Figure 1. Schematic diagram of protein aggregation pathways. Quality control of protein folding in extracellular space. J. J. Yerbury.

E N D
Aggregation of α-Chymotrypsinogen A in Aqueous Solutions Aaron Aziz Advisor: Dr. Yun Liu Colleague: Dr. Jiang Du
What is Protein Aggregation? Figure 1. Schematic diagram of protein aggregation pathways. Quality control of protein folding in extracellular space. J. J. Yerbury. • It is a broad term used to define a type of protein self assembly • Classified as native or nonnative proteins • Can include both soluble and insoluble protein aggregates • Typically these aggregates are unfavorable products
Why is it important? Bio-processing operations 2. Pharmaceuticals 3. Debilitating diseases 4. Cytotoxicity
Our study • α-Chymotrypsinogen A “…30% of the original protein sample aggregated in a period of 2 hours into clusters comprising four or more molecules each.” • Aggregation dynamic of α-Chymotrypsinogen A 2. Broaden this understanding to other proteins Goals: 3. Apply to real world problems Techniques: • Dynamic Light Scattering • Circular Dichroism • Small-Angle Neutron Scattering
Dynamic Light Scattering Results 5 mg/ml pH=7.3 2 h 14 h
Decay Curve Fitting Results I2(t) = A(e-2t/τ) + B clc; clear; h = fopen('testdata.txt', 'r'); data = fscanf(h, '%g %g', [4 inf])'; t = data(:,1); Rexp = data(:,2); loglog(t,Rexp,'ro'); hold on b0 = [.22 40 1]; b = lsqnonlin(@expfunc, b0,[],[],[],data) Rcal = (b(1)*exp(-2*t/b(2))) + b(3); plot(t,Rcal,'b'); k = 2*pi/(782.7e-9/1.33); q = (sqrt(2)*k); D = 1/((b(2)*(10^-6))*(q^2)); a = (1.3806503e-23*298.15)/(6*pi*8.94e-4*D) Hydrodynamic Radius: a = 2.2293e-009 = 2.23 nm Rcal = (b(1)*exp(-2*t/b(2))) + b(3)
Dynamic Light Scattering Results 5 mg/ml pH=7.3 96 h
Dynamic Light Scattering Results 96 h 5 mg/ml pH=7.3 ~ 50000
Dynamic Light Scattering Results Typical Decay Curves 1 mg/ml pH=7
Decay Curve Fitting Results a1 = 2.2110e-009 = 2.21 nm a2 = 9.3650e-008 = 93.7 nm a3 = 8.3982e-007 = 840 nm a1 = 1.9266e-009 = 1.93 nm a2 = 1.9271e-007 = 193 nm a3 = 2.4384e-006 = 2.44 μm
Circular Dichroism 1 mg/ml Chymotrypsinogen pH=7 Fresh 7 Days Circular Dichroism and the Conformational Analysis of Biomolecules. Gerald D. Fasman.
Circular Dichroism 1 mg/ml Chymotrypsinogen pH=7 Fresh 1 Day 2 Days 5 Days 7 Days 9 Days 2 Weeks
Small-Angle Neutron Scattering (SANS) Smeared Sphere Model Radius = 2.0 nm Smeared Sphere Model Radius = 2.1 nm
α-Chymotrypsinogen A Chymotrypsin Conclusion • Aggregate • Linear semi-flexible polymer chain • Does not precipitate
Future Plans • Chymotrypsin Testing • Trypsin Inhibitor • Vary pH • pH = 3 • pH = 9 • pH = 11
Acknowledgements Yun Liu Jiang Du Paul Butler Andrea Hamill Christopher Roberts NIST SURF/NCNR Thank You!
References Velev, O. D, and E. Kaler, and A. Lenhoff. (1998). Protein Interactions in Solution Characterized by Light and Neutron. Biophysical Journal, 75 pp. 2682-2697. Yerbury, J. J, and E. Stewart, and A. Wyatt, and M. Wilson. (2005). Quality control of protein folding in extracellular space. EMBO Reports, 6 (12), pp. 1131-1136.
Materials • α-chymotrypsinogen • deionized water from a Millipore Milli-Q system (solutions for DLS ) • NaCl (used to adjust the electrolyte concentration) • 10 mM citrate buffer (0.01 mol/L) deionized water (1 L) citric acid (192.14 x 0.01= 1.9214 g) • 0.1 M NaOH (0.1 mol/L) deionized water (0.1 L) NaOH (40.01 x 0.01= 0.4001 g) • 0.1 M HCl dilute from concentrated HCl solution