Download
1 / 27
270 likes | 425 Views
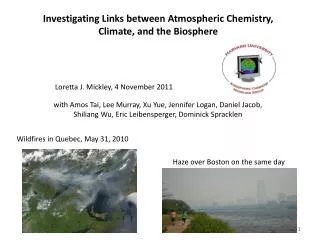
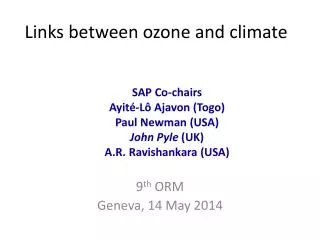
Links between ozone and climate. J. A. Pyle Centre for Atmospheric Science, Dept of Chemistry University of Cambridge Co-chair, SAP 7th ORM, Geneva, 19 May 2008. Historical reminder - a coupled chemistry/climate system GHGs, climate change and ozone Ozone recovery

E N D
Links between ozone and climate J. A. Pyle Centre for Atmospheric Science, Dept of Chemistry University of Cambridge Co-chair, SAP 7th ORM, Geneva, 19 May 2008
Historical reminder - a coupled chemistry/climate system GHGs, climate change and ozone Ozone recovery Ozone change and the climate system Benefits of Montreal Protocol
Clx T Haigh and Pyle, 1982
Approx. observed T Observed T consistent with changed ozone, CO2, etc WMO/UNEP 1998, based on Hansen et al, 1997
GHGs climateO3 • GHGs will cool the stratosphere. This will influence ozone loss by gas phase (make slower) and polar heterogeneous (make faster) chemistry. • GHGs - speed up the stratospheric circulation. Impacts on stratospheric and tropospheric chemistry. • Changed convection in a future climate - could change delivery of (natural, short-lived) halocarbons to the stratosphere. • Other biosphere feedbacks could impact stratosphere.
Scientific Findings (a) (b) (c) (d) ODS production ODS production Ozone-depleting chlorine and bromine in the stratosphere ODS in the atmosphere Ozone levels-measured and predicted Global ozone change UV levels-measured and predicted Ultraviolet radiation change 1980 Now2100 “There is even stronger evidence since the 2002 Assessment that the Montreal Protocol is working”
Return of ozone to pre-1980 levels • ODS are decreasing & the ozone layer is starting its recovery • Climate change and ODSs will affect the future of ozone layer • Decreases in ODS emissions already achieved by MP is the dominant factor in return to pre-1980 values Global ozone layer (60oS-60oN) is expected to recover to pre-1980 values around 2050 But failure to continue compliance with the MP could delay or even prevent the recovery of the ozone layer
O3/ODS climate • Changed stratospheric ozone will change tropospheric UV and IR. • ODS are GHGs - their change has a climate forcing impact • Impact on surface temperature • Impact on tropospheric chemistry, including through changed stratosphere-troposphere transport • Geo-engineering?
Radiative Forcing • Positive direct forcing due to all halocarbons: 0.34 ± 0.03 W/m2 • Positive direct forcing due to ODSs only: 0.33 ± 0.03 W/m2 • Negative indirect forcing due to ozone depletion: -0.15 ± 0.10 W/m2 • Different types of gases make different contributions to positive and negative forcing IPCC/TEAP 2005
The Montreal Protocol net reduction in ODS radiative forcing in 2010 will be equivalent to about 7-12 years of growth in radiative forcing of CO2 from human activities. The Montreal Protocol will have reduced net radiative forcing from ODSs in 2010 by about 0.23 Wm-2, which is about 13% of that due to the accumulated emissions of CO2 from human activities. G. Velders et al., PNAS, 2007
Antarctica • Cooling due to ozone depletion and warming due to greenhouse effects of ODSs may not occur in the same places and times Hadley Center model Observed temperature trend IPCC/TEAP 2005
The world avoided explored in the UKCA chemistry/climate model Chlorine abundance under different scenarios Effective Cl could have reached 9 ppbv at ~2030.
Surface temperature due to O3in the ‘world avoided’ - a 9 ppbv Clx world Simulated temperature change in DJF (Gillett and Thompson, 2003) Temperature change in 9 ppbv simulation in SON.
Surface climate impacts Without MP there would have been significant surface changes
O3 (9ppb Clx - 3.5ppb) These changes lead to a radiative forcing of approximately -0.4Wm-2 Morgenstern et al, submitted, 2008
Radiative Forcing • Positive direct forcing due to all halocarbons: 0.34±0.03 W/m2 • Positive direct forcing due to ODSs only: 0.33±0.03 W/m2 • Negative indirect forcing due to ozone depletion: -0.15±0.10 W/m2 • Different types of gases make different contributions to positive and negative forcing IPCC/TEAP 2005
Impact of Brx change Zonal mean ozone change ΔO3 (ppm) ppm Change in Brx increase ozone destruction Reduction of ozone concentration below 30km ►-90 ppb high lat. / -50 tropics ►-8% UTLS / -2% 20-25 km Olivier Dessens, Cambridge
Austin and Li, GRL, 2006 Climate models show a strengthening of the stratospheric circulation & decrease in ‘age of air’ with increasing GHG concentrations
T (9ppb Clx - 3.5ppb) Morgenstern et al, submitted, 2008
Change in modelled vortex strength between UM runs using 1980 and 2000 background ozone climatologies (20 years each). 1xCO2 2xCO2 Warmer, weaker vortex in “2000”. Colder, stronger vortex in “2000”.
Ozone column Percentage change in mean annual cycle of ozone column
Tropospheric climate Geopotential height trend at 500 hPa (m) in DJFMAM from 1979 to 2000 (Thompson and Solomon, 2002) Geopotential height difference vs reference at 500 hPa in DJF. Southern Annular Mode is strengthened by additional chlorine.
Geopotential height in NH Arctic oscillation pattern, derived from 500 hPa geop. height in winter (Thompson and Wallace, 1998) Difference in geop. height versus reference at 500 m Arctic Oscillation is weakened by additional chlorine