Download
1 / 30
300 likes | 435 Views
The Observations of LAMOST. Jianrong Shi NAOC. 1/7 2014. The Observation of LAMOST. Jianrong Shi (NAOC). Overview. The structure of LAMOST The observation preparation How to select the plate The results from one year Pilot and two year standard surveys. Structure of LAMOST.

E N D
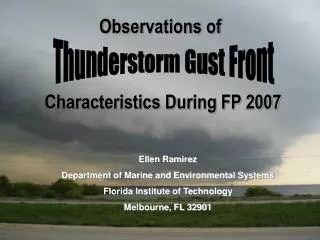
The Observations of LAMOST Jianrong Shi NAOC 1/7 2014
The Observation ofLAMOST Jianrong Shi (NAOC)
Overview • The structure of LAMOST • The observation preparation • How to select the plate • The results from one year Pilot and two year standard surveys
Structure of LAMOST MA mirror 5.72m×4.4m 4000 Fiber Positioning 4000 Fibers MB mirror 6.67 m×6.05m 16 Spectrographs 32 CCDs
Characteristics of LAMOST • A horizontal meridian reflecting Schmidt telescope with an active correcting plate • large field of view (5 deg) + large aperture (4m) Active optics on thin-mirror & segmented mirrors • 4000 optical fibers on focal surface Parallel controllable fiber positioning
The observation preparation Focus the MB ( Shack-Hartman MA) ~5mintues Focus the MA and four guiding stars (center star V < 8 mag. ) ~25mintues Moving the fibers to the accurate positions (9mintues) (Which can be done during the focus)
Segmented and thin mirror active optics for 24 sub-mirrors of MA
4000 fiber positioning units (1.75m) S-H sensor for MA Guiding CCDs
The site conditions The statistics of the number of hours of BATC observations per night from 2004-01-01 to 2007-09-30. The dashed line shows the theoretical available time.
Sky brightness The sky brightness in V band obtained from BATC Polaris monitor data, as a function of time from 1995 to 2011.
Telescope Seeing: 3-5 arcsec (dome + site) • Site seeing: < 2 arcsec ; Fiber size: 3.3 arcsec • has a field of view as large as 20 square degrees, the effective aperture varies from 3.6 to 4.9 meters in diameter (depending on the pointing). Enables it to take 4000 spectra in a single exposure at resolution R = 1800.
Seeing Comparing the seeing from guide star and DIMM during Pilot Survey (Oct. 24, 2011- Match 30, 2012 )
How to select the Plate Observational conditions: (240m) weather, Moon phase, left time and seeing etc. VB(9.0<r<14.0) 3*10m B (14.0<r<16.3) 3*20m – 3*25m M(16.3<r<17.8) 3*30m F(17.8<r<18.5) 3*30m readout ~ 8m Wish to observe two B plates and more VB plates
The results from pilot survey Spectra with S/N>10(gor i band) spectra plate success ratio pilot: 597,032 397 45.6% First year: 1,191,414 768 57.9% Second year:1,207,119 697 64% success ratio: the ratio of the Spectra with S/N>10 to all the selected targets Observed time: 914h, 1278h and 1356h
The reason for the less plates during the second year Increase the time for foucs MB、B plate from20 -25 minutes, added one lamp observation and more M plates observed LSS-GACDR1 B:76 M:30 F:4 DR2 B:75 M:44 The instrumental fail rate(The ratio of the lost time due to the instrumental problem to the observation time) Pilot: 12.5% first:5.3% second:4.4%