Download
1 / 16
170 likes | 322 Views
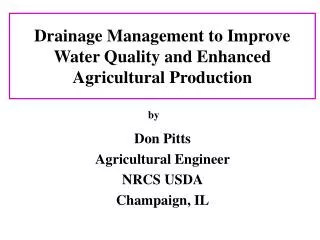
Regulatory Approaches to Address Agricultural Water Quality. Catherine L. Kling Department of Economics Center for Agricultural and Rural Development Iowa State University Iowa Water Conference March 5, 2013. Topics. Economics, externalities and market failure

E N D
Regulatory Approaches to Address Agricultural Water Quality Catherine L. Kling Department of Economics Center for Agricultural and Rural Development Iowa State University Iowa Water Conference March 5, 2013
Topics • Economics, externalities and market failure • Types of Environmental Regulations • Examples from outside of Agriculture • Examples directly related to AGriculture
Economics • Nutrients leaving fields and entering waterways are classic example of an “externality,” --- a form of market failure • Externality = unintended side effect of production that imposes costs on others • Market outcomes are not efficient when externalities are not accounted for
Economics: Corrective Measure for Externalities • Taxes • Subsidies (cost share) • Voluntary Approaches (not subsized) • Regulations • Technology requirements • Standards (permits) • Permit trading, “cap-and-trade,” “offsets” • Other (compliance requirements, labeling requirements)
Economics: Policy Goals • Achieve environmental improvement goals 2. Do so at lowest cost possible Generally agnostic about final incidence (who ultimately pays the cost) Consumers, Producers, Taxpayers ?
Some Regulation types • Technology Requirements: required to adopt specific method of production or technology e.g., catalytic converters, scrubbers, ban DDT,etc. • Standards: required to have permits to cover their emissions and/or to meet limits e.g., vehicle emission standards, TSP standards, zoning requirements, etc. • Cap and trade: aka marketable permits • Cross Compliance: conservation compliance • Labeling requirements, e.g., TRI, dolphin safe
Example Regulation: Point Sources and the Clean Water Act • 1972: Federal Water Pollution Control Act Amendments, Permits required to discharge • Permits are based on • technology requirement and • water quality based limits • Permit requirements apply to • 5 conventional pollutants, • 126 toxic and priority pollutants, and • non-conventional pollutants (includes N and P)
Example Regulation: Point Sources and the Clean Water Act • 48,000 NPDES permits issued to industrial facilities, plus general permits • Enforcement, permits stipulate sampling and monitoring methods, EPA and state agencies can inspect and issue fines for noncompliance • Major water quality improvement across U.S. attributed to the permits requirements
Example Regulation: Air Quality and the Clean Air Act • SO2 market in Clean Air Act • 1990 Clean Air Act Amendments • Regulated SO2 discharges from power plants • Made them tradable: cap-and-trade • Producer could meet cap themselves or could buy credits from those who exceeded their clean up • SO2 emissions from have fallen from 17.3 million tons in 1980 to about 7.6 million tons in 2008, a decrease in emissions of 56 percent (EPA)
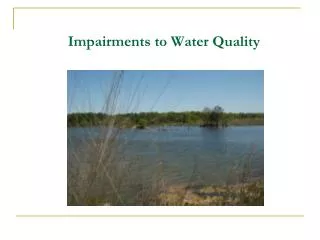
Environmental Regulations in Agriculture • Nonpoint Sources largely exempted from Federal Clean Water Act, but states can regulate • Winter bans on manure spreading: Vermont and Maine • Vegetative buffer requirements: Minnesota, agricultural areas near waterways require 50’ buffer strips • California: zoning and more
Maryland: Chesapeake Bay • October 15, 2012 • NMPs that were current as of October 15, 2012 will be considered valid. All plans developed after this date must conform to the new requirements. • Spring 2013 • All farmers must incorporate organic nutrients into the soil within 48 hours of application. • Fall 2013 • Farmers are required to plant cover crops when applying organic nutrient sources to fallow ground in the fall. New limits for fall nitrogen applications on small grains take effect for all farmers. • January 1, 2014 • A 10 to 35 ft. “no fertilizer application zone” must be in place adjacent to surface waters and streams. Pasture management practices must be installed to protect streams. • July 1, 2016 • Nutrient applications are prohibited between Nov 1 and March 1 for Eastern Shore farmers and between Nov15 and March 1for Western Shore • http://mda.maryland.gov/resource_conservation/counties/NMPqanda.pdf
BMPs: Everglades Agricultural Area Everglades Regulatory Program • goal 25% P reduction overall • mandatory BMPs, 1995 • Implemented via points • flexibility in BMPs, 25 points/farm • expert judgment set point values • must implement and monitor WQ Wikipedia
EAA Regulatory Program • EAA= 283,000 ha (~700,000 acres) • Mainly sugarcane, some sod, vegetables and rice • First 3 years: 55% P load reduction (SFWMD, 1998)
Results of Program: Phosphorus Loads FIGURE 3. Annual basin-level total phosphorus load percentage reduction from the Everglades Agricultural Area (WY1980–2008). Samira H. Daroub, Stuart Van Horn, Timothy A. Lang & Orlando A. Diaz (2011): Best Management Practices and Long-Term Water Quality Trends in the Everglades Agricultural Area, Critical Reviews in Environmental Science and Technology, 41:S1, 608-632