Download
1 / 46
460 likes | 618 Views
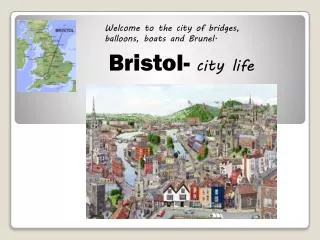
Improving Energy Efficiency in Buildings. Paul Isbell Energy Manager Bristol City Council UK. Bristol. Map of UK Electricity Supply Areas. Bristol. paul.isbell@bristol.gov.uk. Whole City Foot Print.

E N D
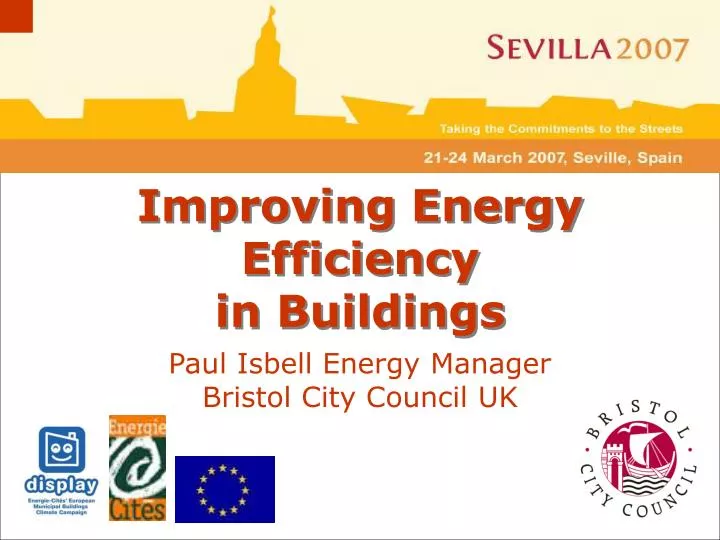
Improving Energy Efficiency in Buildings Paul Isbell Energy Manager Bristol City Council UK
Bristol Map of UK Electricity Supply Areas
Bristol paul.isbell@bristol.gov.uk
Whole City Foot Print • Bristol's ecological footprint in 2003 was 191 times the size of the city. If everyone on the earth had the same lifestyle and used the same quantity of resources as the residents of Bristol, we would need three Earths to sustain us.
The last 160,000 years (from ice cores) and the next 100 years 700 CO2 in 2100 (with business as usual) 600 Double pre-industrial CO2 500 Lowest possible CO2 stabilisation level by 2100 400 CO2 concentration (ppm) CO2 now 300 200 160 120 80 40 Now Time (thousands of years)
The Task Carbon Managment Awarness Raising Investment Purchaseing Policy Development Monitor and Target
Know Your Building • How much energy is being used? • If you don’t measure it you can not control it. • When is the energy being used? • Measure consumption over time. Half hour data • Who is using the energy? • Examine wastage – e.g. high consumptions at night. • Is the amount being used high or low for the building type? • Display Certificate
Example 27% use at night – Why? Computers Lights Cleaners Kitchens Fridges Drink Machines Caretakers Security Lights
Controls • Awareness • Savings • Improvements • Lighting • Heating etc Hard to get at Savings Building Energy Use Time Reduction Aware/Active Occupants Energy Reduction
1. Energy Performance Certificates
Certificate Where is it ? Can any one understand it ? Who is interested ?
2. Energy Awarness Raising
Disjointed Programmes • A few posters won’t change peoples actions • Awareness not linked into any feed back will fail ! • Needs to be constantly reinforced
The amazing piece of equipment to solve the problem
4 Stages of Energy Awareness Unconscious / incompetent Conscious / incompetent Conscious / competent Unconscious / competent
What is DisplayTM? • A European Campaign for the implementation of an “energy ratings” poster displaying CO2 emissions as well as energy and water consumption's in municipal buildings. • Anticipating the entry into force of the European Building Directive by encouraging a “bottom-up”- oriented approach. Preparing the grounds for it’s implementation. • Linked to energy awareness tools to imbed changed actions
European Buildings Directive article 7… • “Member States shall take measures to ensure that for buildings with a total useful floor area over 1,000 m2 occupied by public authorities and by institutions providing public services to a large number of persons and therefore frequently visited by these persons an energy certificate, not older than 10 years, is placed in a prominent place clearly visible to the public. • Clearly visible to the Occupants • who know what it means !
Display Logo provides link back to awareness programmes Property Name Energy Ratings: Energy, CO2 & Water. A to G Scale Yearly Averages Energy Sources Actions to take to improve ratings CategoryDetails Logo & Contact Details
On-line Calculation Tool -Transparent methodology • Users guide provides a detailed description of the calculation process. • Step by step process • Straightforward
Assets of DisplayTM • Excellent visual way of showing energy performance whilst complying with Building Regs • ‘ Corporate Identity ’ for awareness material • Makes energy and climate issues comprehensible to non-specialists • Encourages people to take action to change their habits • Helps to promote in-house initiatives and tells staff & public ‘ we are doing our bit ’ .
Assets of DisplayTM • Increases dialogue from elected members and senior management to security staff & cleaners. • Extensive handbook. • Excellent on-line resources: www.display.org • Several project co-ordinators to answer e-mail & ‘phone queries.
Communication • internal e-mail newsletter (distribution around 6,000) Electronic Weekly News, • Citywide Newsletter “The Bristol News” (distributed to every home in Bristol – up to 150,000), • The Energy Echo, the Energy Management Units newsletter/poster • Use the display logo on posters and stickers in the conventional manner.
Tools – News Letter (Fixed to back of toilet doors widely read)
Media Intrest Visit from MP & Government Minister
More to come ! • Linking in with Eco Schools • Development of a managers competency training pack • Hopefully Display Plus
Conclusions The Display-Campaign:Anticipates the entry into force of the EPBD • Is Adaptable to national implementation schemes • Bridges the gap between Europe and its citizens • Tells Staff & Members of the public they can help to improve ratings in their buildings. By providing feed back.