Download
1 / 36
360 likes | 471 Views
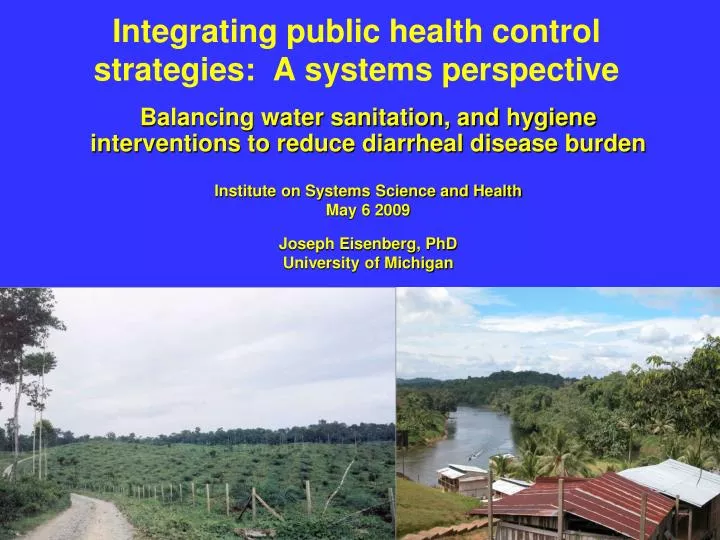
Integrating public health control strategies: A systems perspective. Balancing water sanitation, and hygiene interventions to reduce diarrheal disease burden Institute on Systems Science and Health May 6 2009 Joseph Eisenberg, PhD University of Michigan.

E N D
Integrating public health control strategies: A systems perspective Balancing water sanitation, and hygiene interventions to reduce diarrheal disease burden Institute on Systems Science and Health May 6 2009 Joseph Eisenberg, PhD University of Michigan
Towards Developing Intervention Strategies • Balancing water sanitation, and hygiene interventions to reduce diarrheal disease burden • Little understanding of the integration of these environmental control strategies. • Transmission models can capture the interdependent transmission pathways of enteric pathogens. • For example, does the efficacy of household water quality interventions depend on the level of sanitation? • Conclusions differ for different study settings and study designs
Intervention Trials: Summary of Findings • Evidence from IT suggest interventions are efficacious (Fewtrell et al 2005) • Water quality • Point of use • Pooled relative risk: 0.65 (0.48, 0.88) • Range from no effect to 0.15 • Water supply • Pooled relative risk: 1.03 (0.73, 1.46). • Range from no effect to 0.62 • Hygiene • Pooled relative risk: 0.55 (0.40, 0.75) • Range of relative risks: 0.27 - 0.89 • Sanitation • Pooled relative risk: 0.68 (0.53, 0.87) • Only based on two studies • Multiple interventions • No evidence for additional benefits when adding sanitation or hygiene interventions to a water quality intervention
Intervention Trials: Summary of Findings • Are intervention trials the gold standard for environmental epidemiology? Issues of internal and external validity • Randomization • Employed in only 31% of IT reviewed in Fewtrell et al. • Lack of blinding • Few studies in the developing world are blinded • Selection bias • Who is participating in the study • Publication bias • Are negative studies published at same rate as positive studies? • Generalizability (external validity) • Can results of small cohort studies be applied other populations? • Compliance • Relevance to “real world” application of intervention • Most of these biases result in an over-estimate of preventable fraction • Observational studies may provide more effectiveness data
Observational data: Summary of Findings • Analysis of Demographic Health Surveys • From 27 different African countries collected between 1995 and 2003 • Suggests multiple interventions are synergistic • Systematic reviews of intervention trials do not suggest this synergy • Suggests smaller effect estimates than obtained from intervention trials
Intervention Trials: Summary of Findings • Why do we observe variability in the efficacy of studies? • Studies differ in design/quality • Settings differ (demographics, environmental factors, etc) • Settings differ with respect to those pathways that are sufficient to transmit disease • Suggests the need for integrated control • Evidence from • Esrey (1996). Cross-sectional analysis of DHS • Gundry (2005). Meta-analysis • Vanderslice and Briscoe (1995). Cohort study
Pathways of Disease Transmission:Interdependencies • Multiple pathogens, hosts, and environmental niches result in a complex transmission system • Pathogens • Viruses, bacteria, protozoa • Hosts/Reservoirs • Animals, humans, environment • Routes • Foodborne, Person-person, Waterborne, Animal-person
Transport to other water sources Agricultural Runoff Bathing/washing Recreational Drinking Water Poor Sanitation Wastewater reuse Animals Person-person Food Disease Transmission Process: Source of interdependencies • How do village conditions, such as hygiene and sanitation, affect the impact of drinking water interventions?
Village-level transmission analysis:Regional description • Coastal rainforest • 21 villages in study • All along one of three river basins: Santiago, Cayapas, or Onzole • Household structure • Median size = 6 • A few above 15
Model structure 2500 households Household sizes match distribution of Ecuador study site Individuals are initially susceptible Population is closed No one enters or leaves (no births or deaths) Infection transmission Individuals can only become infected once and then have life long immunity Relevant for viral infections Reasonable if using model to examine outbreaks over small time scales Network structure Individuals are homogeneous within households Households are homogeneous within villages S S S S S S S S S S S S S S S S Breakdown of the Model
State variables All individuals can be classified into one of three states Susceptible, where Si represents the number of susceptible individuals in household i. Infected, where Ii represents the number of infected individuals in household i. Immune to further infection, where Ri represents the number of immune individuals in household i. Then Ni and N represents the total number of people living in household i and in the community respectively I I I S R S S R S I S S S S S S Breakdown of the Model
State variables There is one environmental state variable The concentration of pathogens in the water This environmental state is governed by two environmental rate parameters Infected individuals shed pathogen into the drinking water supply f governs the rate of shedding The total number of pathogens shed is directly dependent on the total number of infected individuals, Itotal . Pathogens in drinking water and the environment die off at a constant rate m governs the pathogen die-off rate I I I S R S S R S I S S S S S S Breakdown of the Model
Four transmission routes are possible People can become infected by being exposed to an infected person in their household bh governs this route of infection S I S S S S S S S S I S S S S S S S S S Pathogen from the Environment Pathogen from Drinking Water Breakdown of the Model • People can become infected by being exposed to an infected person from another household in their community • bc governs this route of infection • People can become infected by being exposed to pathogens from the environment (does not include drinking water) • be governs this route of infection • People can become infected by consuming pathogens in drinking water • bdw governs this route of infection
One other possible event can occur Infected individuals recover and are no longer infectious or susceptible to re-infection r governs the rate of recovery S R I S S S S S Breakdown of the Model
These events translate into hazards Hazard of a household infection event This is proportional to the number of susceptible and the number of infected individuals within a household Breakdown of the Model • Hazard of a community-level infection event • This is proportional to the number of susceptible individuals within a household and the number of infected individuals within the community • Hazard of an environmental infection event • This is proportional to the number of susceptible individuals within a household
These events translate into hazards (continued) Hazard of a recovery event This is proportional to the number of infected individuals within a household Breakdown of the Model • Hazard of a drinking water infection event • f governs the rate of shedding • m governs the pathogen die-off rate in the water
Simulation of model We use the Gillespie algorithm Time to event (as opposed to clock driven) Once we define the hazards we can calculate Time to next event Decide which event occurred Both of these calculations are stochastic (so every simulation will be a little different) After each event bookkeeping is required To keep track of individuals that change infection status S → I I → R As well as keeping track of the pathogen concentration in the water Each simulation is run for one year Incidence (# of new cases over that year) is the average of 10 simulation runs Breakdown of the Model
Model Parameters Simulation analysis looks at increasing values of: Contamination (proxy for sanitation) Household and community level transmission (proxy for hygiene
Application to Village-level Rural Setting • How do village conditions, such as hygiene and sanitation, affect the impact of drinking water interventions? • Extreme example • Secondary transmission is strong due to poor hygiene. • Improving the water quality would have minimal effect on the incidence of disease. • In reality levels of hygiene and sanitation are intermediate. • Need model to quantify impact intervention.
Analysis Plan for Model Analysis • The causal relationship between drinking water and disease can be assessed in the following “thought experiment” • Assume A, where A=1 means the individual is exposed and A=0 the individual is not exposed • The population risk when everyone is exposed is IA=1 • The population risk when no one is exposed is IA=0 • The excess risk is therefore: IA=1- IA=0 • The problem: Empirically only one of these populations is observable, the other is a counterfactual population.
Analysis Plan for Model Analysis • For a non-Infectious disease process we are fine since we can assume independence • P(Y1) - P(Y0) = P(Y | exposed) - P(Y | unexposed) • P(Y | exposed) and P(Y| unexposed) can be estimated from a randomized trial. • For an infectious disease process, however, we cannot assume independence • i.e., P(Y1) - P(Y0) P(Y | exposed) - P(Y | unexposed). • We can estimate P(Y1) and P(Y0) using a disease transmission model, where the force of infection can be represented as . S . I Y takes on 1 (for disease) or 0 (for no disease) Y1takes on 1 (for disease) or 0 (for no disease) for a population where everyone is exposed Y0 takes on 1 (for disease) or 0 (for no disease) for a population where everyone is not exposed
Analysis Plan for Model Analysis • Calculate the cumulative incidence, I, when a novel pathogen is introduced into a community 1. Estimate the risk in a population when everyone is exposed to drinking water contamination, IA=1. 2. Estimate the risk in a population when no one is exposed to drinking water contamination, IA=0. Preventable fraction (PF) = PF = IA=1 - IA=0
Results • The fraction of disease prevented due to the water quality intervention ranged from a few percentage points to over 75% • This variation is completely explained by three parameters • f. Water contamination • bh. Household level transmission rate • bc. Community level transmission rate
Results • When water quality is good water interventions do not prevent disease Low levels of contamination Preventable Fraction scale (dark blue = 0%, Red = 80%)
Results • As water quality decreases, water interventions prevent more disease Higher levels of contamination Preventable Fraction scale (dark blue = 0%, Red = 80%)
Results • As water quality decreases more, the efficacy of water interventions depend on other transmission pathways High levels of contamination Preventable Fraction scale (dark blue = 0%, Red = 80%)
Summary of Simulation Results • Water quality interventions may not always decrease disease burden • Even when water contamination exists • Efficacy depends on other transmission pathways governed by hygiene, sanitation, and food practices • Under conditions in which each pathway alone is sufficient to maintain disease single pathway interventions will have minimal benefit • Must develop intervention strategies that eliminate all sufficient pathways • Models provide a framework to evaluate necessary and sufficient causes
Systems Perspectives: Definitions Environmental Exposure to Norovirus Prevalence of Norovirus • An assemblage of inter-related elements comprising a unified whole • Feedback is a central property of a system Environmental levels of Norovirus • System dynamics is concerned with behavior over time • This includes feedback loops, time delays, stocks and flows. • Behavior is not simply the sum of the parts (individuals) • Shift focus from individual to population level processes Introduction of new strains of pathogens via movement/ migration patterns Road Construction (a dynamic process) Deforestation Spread of these pathogens to villagers not directly connected to road Climate Change, food distribution patterns, economies, social structures, Watershed hydrology
Why a Systems Perspective? • Modern Epidemiology has been successful in identifying important individual risk factors • Has informed health policy • Increasingly, health issues that we are asked to address are embedded in complex social and environmental processes • The appropriate scale of intervention is no longer the individual • This is true across many scales • Infection transmission links transmission pathways • Roads affect migration/movement patterns that affect disease transmission • Deforestation impacts climate variability that impacts disease transmission
Why a Systems Perspective? • Epidemiologic perspective • Data sources • Individual reports of disease and risk factors • Analysis: Risk factor based • Are risk behaviors within individuals associated with disease outcomes? Assumes independence of observations. • Individual level risk factor studies (results are mixed) • Can mask the effects (no one is completely unexposed) • Village level transmission has the potential to link everyone in the village • Regional transmission can link villages
Why a Systems Perspective? • Systems perspective • Data sources • Contact patterns • Analysis: Modeling of causal linkages to raise level of analysis to population level (independent units) • For an infectious disease process, the risk of infection is dependent on the disease status of others. • Models can account for these dependencies. • Developing causal models that relax the assumption of independence • Accounting for the interdependency of transmission routes: foodborne, waterborne, soilborne, person to person • Social structures affect how pathogens flow through communities and regions • The model presented here assumed full mixing
Why a Systems Perspective?Complementing an individual level risk factor approach • Social dimension of infection spread • Patterns of infection spread are dynamic (human and animal) • Food sharing networks • Beyond who ate the cheese cake • Social capital creating conditions for improved infrastructure • Causal system models provide theory to help inform • Data: Define needs and direction • Study design: Structure for appropriate inference • Intervention strategies: a means to generalize and thereby examine alternative intervention strategies
Systems Perspectives: Model Form • Model structure can take on many forms • Discrete vs. continuous; deterministic vs. stochastic; or analytic vs. computational • Ordinary differential equations, partial differential equations, markov chains, individual based models • Equation based vs. agent based • Analysis can take on the form of phase plane, nullclines, stability, or be simulation-based • Our model presented here is a household-based stochastic model • Decision on scale was based on mode of intervention • Decision on structure was based on • The understanding of transmission • Question of interest
Systems Perspectives: Categories in Epidemiology • Infectious disease • Flows of infection through populations • Social structure is important • Social determinants • Social networks help us understand these determinants (sexual, food sharing, peer/family/cultural influences) • Externalities need to be taken into account (laws, customs, etc) • Ecological determinants • Environment processes such as climate can be important drivers • Vector ecology must be taken into account (mosquito host seeking behavior, flight range, temperature dependencies, etc.) • Determinants of health can occur at different scales • Human population dynamics • Demographic shifts over time; immigration and emigration processes • Within host population dynamics • PBPK, Life stage of disease progression, immune system