Download
1 / 1
10 likes | 90 Views
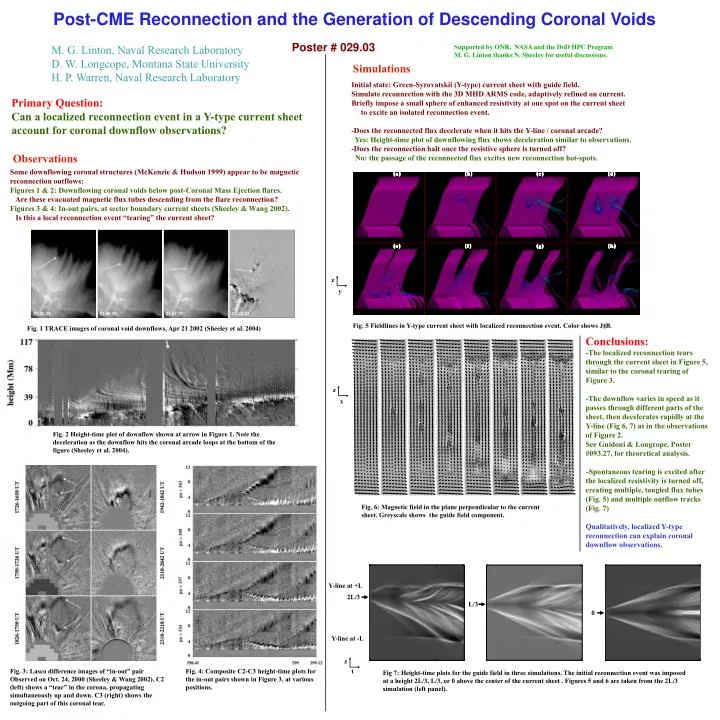
Post-CME Reconnection and the Generation of Descending Coronal Voids. Poster # 029.03. M. G. Linton, Naval Research Laboratory D. W. Longcope, Montana State University H. P. Warren, Naval Research Laboratory. Supported by ONR, NASA and the DoD HPC Program

E N D
Post-CME Reconnection and the Generation of Descending Coronal Voids Poster # 029.03 M. G. Linton, Naval Research Laboratory D. W. Longcope, Montana State University H. P. Warren, Naval Research Laboratory Supported by ONR, NASA and the DoD HPC Program M. G. Linton thanks N. Sheeley for useful discussions. Simulations Initial state: Green-Syrovatskii (Y-type) current sheet with guide field. Simulate reconnection with the 3D MHD ARMS code, adaptively refined on current. Briefly impose a small sphere of enhanced resistivity at one spot on the current sheet to excite an isolated reconnection event. -Does the reconnected flux decelerate when it hits the Y-line / coronal arcade? Yes: Height-time plot of downflowing flux shows deceleration similar to observations. -Does the reconnection halt once the resistive sphere is turned off? No: the passage of the reconnected flux excites new reconnection hot-spots. Primary Question: Can a localized reconnection event in a Y-type current sheet account for coronal downflow observations? Observations Some downflowing coronal structures (McKenzie & Hudson 1999) appear to be magnetic reconnection outflows: Figures 1 & 2: Downflowing coronal voids below post-Coronal Mass Ejection flares. Are these evacuated magnetic flux tubes descending from the flare reconnection? Figures 3 & 4: In-out pairs, at sector boundary current sheets (Sheeley & Wang 2002). Is this a local reconnection event “tearing” the current sheet? z y Fig. 5 Fieldlines in Y-type current sheet with localized reconnection event. Color shows J∥B. Fig. 1 TRACE images of coronal void downflows, Apr 21 2002 (Sheeley et al. 2004) • Conclusions: • -The localized reconnection tears through the current sheet in Figure 5, similar to the coronal tearing of Figure 3. • -The downflow varies in speed as it passes through different parts of the sheet, then decelerates rapidly at the Y-line (Fig 6, 7) as in the observations of Figure 2. • See Guidoni & Longcope, Poster #093.27, for theoretical analysis. • -Spontaneous tearing is excited after the localized resistivity is turned off, creating multiple, tangled flux tubes (Fig. 5) and multiple outflow tracks (Fig. 7) • Qualitatively, localized Y-type reconnection can explain coronal downflow observations. z x Fig. 2 Height-time plot of downflow shown at arrow in Figure 1. Note the deceleration as the downflow hits the coronal arcade loops at the bottom of the figure (Sheeley et al. 2004). Fig. 6: Magnetic field in the plane perpendicular to the current sheet. Greyscale shows the guide field component. Y-line at +L 2L/3 L/3 0 Y-line at -L z Fig. 3: Lasco difference images of “in-out” pair Observed on Oct. 24, 2000 (Sheeley & Wang 2002). C2 (left) shows a “tear” in the corona, propagating simultaneously up and down. C3 (right) shows the outgoing part of this coronal tear. Fig. 4: Composite C2-C3 height-time plots for the in-out pairs shown in Figure 3, at various positions. t Fig 7: Height-time plots for the guide field in three simulations. The initial reconnection event was imposed at a height 2L/3, L/3, or 0 above the center of the current sheet . Figures 5 and 6 are taken from the 2L/3 simulation (left panel).