Download
1 / 19
190 likes | 294 Views
TOMASZ MROZEK ASTRONOMICAL INSTITUTE, WROCŁAW UNIVERSITY. Energy-height relation for hard X-ray footpoint sources observed by RHESSI. 2. METHOD. - Make images in the wide energy range divided into intervals of few keV , in steps of 1 keV . - Determine positions

E N D
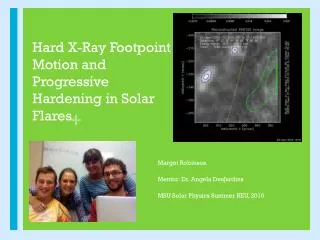
TOMASZ MROZEK ASTRONOMICAL INSTITUTE, WROCŁAW UNIVERSITY Energy-height relation for hard X-ray footpoint sources observed by RHESSI.
2. METHOD - Make images in the wide energy range divided into intervals of few keV, in steps of 1 keV. - Determine positions of centroids - Fit the power-law function: The altitude of centroids (asterixs) above a reference level versus the energy of hard X-rays. The power-law function fit is presented with dottedline.
Inverse it: From thick-target model ( ):
Brown, J. C., Aschwanden, M. J., and Kontar, E. P., 2002, Solar Phys. 210, 373 Aschwanden, M. J., Brown, J. C., and Kontar, E. P., 2002, Solar Phys. 210, 383 * C7.5 * N16W80 * NOAA 9825
• PseudoColor picture– the TRACE 171 Å image, obtained after the maximum; • contours – the TRACE 171 Å images obtained during the impulsive phase, the times are given above each frame; • crosses – locations of centroids of hard X-ray sources, the times are the same as above, brighter colours represent the higher energies; the solar limb is overplotted.
Relations made for consecutive 12s intervals covering the first, main peak. Time evolution is represented by the brightness. The first interval is the darkest one.
Number of events Number of events Number of events Thick of the collisional-stopping region [km]
Comparision between several models of density (Aschwanden et al. 2002)and densities obtained from RHESSI observations.