Download
1 / 56
560 likes | 628 Views
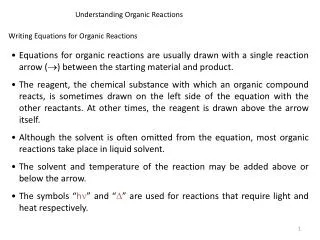
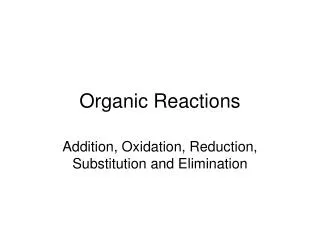
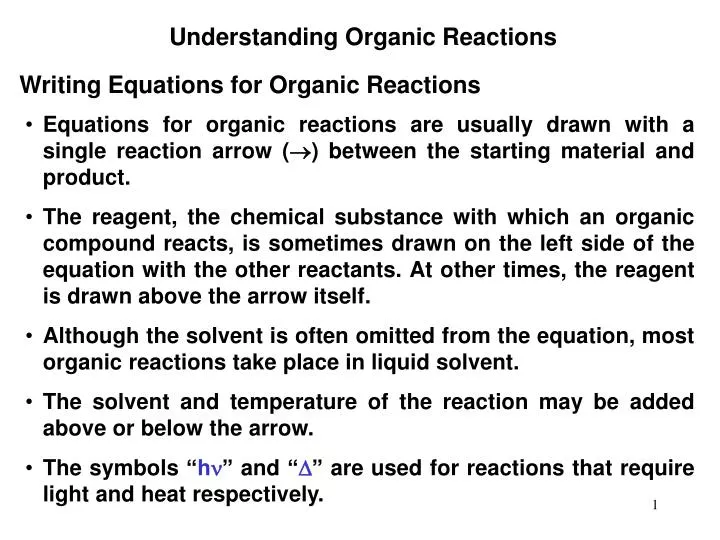
Understanding Organic Reactions. Writing Equations for Organic Reactions. Equations for organic reactions are usually drawn with a single reaction arrow ( ) between the starting material and product.

E N D
Understanding Organic Reactions Writing Equations for Organic Reactions • Equations for organic reactions are usually drawn with a single reaction arrow () between the starting material and product. • The reagent, the chemical substance with which an organic compound reacts, is sometimes drawn on the left side of the equation with the other reactants. At other times, the reagent is drawn above the arrow itself. • Although the solvent is often omitted from the equation, most organic reactions take place in liquid solvent. • The solvent and temperature of the reaction may be added above or below the arrow. • The symbols “h” and “” are used for reactions that require light and heat respectively.
Figure 6.1 Different ways of writing organic reactions
When two sequential reactions are carried out without drawing any intermediate compound, the steps are usually numbered above or below the reaction arrow. This convention signifies that the first step occurs before the second step, and the reagents are added in sequence, not at the same time.
Kinds of Organic Reactions • A substitution is a reaction in which an atom or a group of atoms is replaced by another atom or group of atoms. • In a general substitution, Y replaces Z on a carbon atom.
Substitution reactions involve bonds: one bond breaks and another forms at the same carbon atom. • The most common examples of substitution occur when Z is a hydrogen or a heteroatom that is more electronegative than carbon.
Elimination is a reaction in which elements of the starting material are “lost” and a bond is formed.
In an elimination reaction, two groups X and Y are removed from a starting material. • Two bonds are broken, and a bond is formed between adjacent atoms. • The most common examples of elimination occur when X = H and Y is a heteroatom more electronegative than carbon.
Addition is a reaction in which elements are added to the starting material.
In an addition reaction, new groups X and Y are added to the starting material. A bond is broken and two bonds are formed.
Addition and elimination reactions are exactly opposite. A bond is formed in elimination reactions, whereas a bond is broken in addition reactions.
Classify each of the following as either substitution, elimination or addition reactions. a) substitution b) addition c) elimination
Bond Making and Bond Breaking • A reaction mechanism is a detailed description of how bonds are broken and formed as starting material is converted into product. • A reaction can occur either in one step or a series of steps.
Regardless of how many steps there are in a reaction, there are only two ways to break (cleave) a bond: the electrons in the bond can be divided equally or unequally between the two atoms of the bond.
Homolysis and heterolysis require energy. • Homolysis generates uncharged reactive intermediates with unpaired electrons. • Heterolysis generates charged intermediates.
To illustrate the movement of a single electron, use a half-headed curved arrow, sometimes called a fishhook. • A full headed curved arrow shows the movement of an electron pair.
Homolysis generates two uncharged species with unpaired electrons. • A reactive intermediate with a single unpaired electron is called a radical. • Radicals are highly unstable because they contain an atom that does not have an octet of electrons. • Heterolysis generates a carbocation or a carbanion. • Both carbocations and carbanions are unstable intermediates. A carbocation contains a carbon surrounded by only six electrons, and a carbanion has a negative charge on carbon, which is not a very electronegative atom.
Figure 6.2 Three reactive intermediates resulting from homolysis and heterolysis of a C – Z bond
Radicals and carbocations are electrophiles because they contain an electron deficient carbon. • Carbanions are nucleophiles because they contain a carbon with a lone pair.
Heterolytically cleave each of the carbon-hetratom bonds and label the organic intermediate as a carbocation or carbanion a) carbocation b) carbanion
Bond formation occurs in two different ways. • Two radicals can each donate one electron to form a two-electron bond. • Alternatively, two ions with unlike charges can come together, with the negatively charged ion donating both electrons to form the resulting two-electron bond. • Bond formation always releases energy.
A number of types of arrows are used in describing organic reactions.
Use arrows to show the movement of electrons in the following reactions. a) b) c)
Bond Dissociation Energy • The energy absorbed or released in any reaction, symbolized by H0, is called the enthalpy change or heat of reaction. • Bond dissociation energy is the H0 for a specific kind of reaction—the homolysis of a covalent bond to form two radicals.
Because bond breaking requires energy, bond dissociation energies are always positive numbers, and homolysis is always endothermic. • Conversely, bond formation always releases energy, and thus is always exothermic. For example, the H—H bond requires +104 kcal/mol to cleave and releases –104 kcal/mol when formed.
Comparing bond dissociation energies is equivalent to comparing bond strength. • The stronger the bond, the higher its bond dissociation energy. • Bond dissociation energies decrease down a column of the periodic table. • Generally, shorter bonds are stronger bonds.
Which has the higher bond dissociation energy? • H-Cl or H-Br b) c)
Bond dissociation energies are used to calculate the enthalpy change (H0) in a reaction in which several bonds are broken and formed.
Bond dissociation energies have some important limitations. • Bond dissociation energies present overall energy changes only. They reveal nothing about the reaction mechanism or how fast a reaction proceeds. • Bond dissociation energies are determined for reactions in the gas phase, whereas most organic reactions occur in a liquid solvent where solvation energy contributes to the overall enthalpy of a reaction. • Bond dissociation energies are imperfect indicators of energy changes in a reaction. However, using bond dissociation energies to calculate H° gives a useful approximation of the energy changes that occur when bonds are broken and formed in a reaction.
Calculate H for each of the following reactions, knowing H of O2 and O-H = 119 kcal/mol, H of C-H = 104 kcal/ml and H of one C=O = 128 kcal/mol. a) Bonds Formed Bonds Broken C-H = 4 x 10⁴ kcal/mol = 416 kcal/mol C-O = 2 x -128 kcal/mol = -256 kcal/mol O-O = 2 x 119 kcal/mol = 238 kcal/mol O-H = 4 x -119 kcal/mol = -476 kcal/mol H = 416 + 238 = +654 kcal/mol H = -256 + -476 = -732 kcal/mol H = 654 + -732 kcal/mol = -78 kcal/mol
Thermodynamics • For a reaction to be practical, the equilibrium must favor products and the reaction rate must be fast enough to form them in a reasonable time. These two conditions depend on thermodynamics and kinetics respectively. • Thermodynamics describes how the energies of reactants and products compare, and what the relative amounts of reactants and products are at equilibrium. • Kinetics describes reaction rates. • The equilibrium constant, Keq, is a mathematical expression that relates the amount of starting material and product at equilibrium.
The size of Keq expresses whether the starting materials or products predominate once equilibrium is reached. • When Keq > 1, equilibrium favors the products (C and D) and the equilibrium lies to the right as the equation is written. • When Keq < 1, equilibrium favors the starting materials (A and B) and the equilibrium lies to the left as the equation is written. • For a reaction to be useful, the equilibrium must favor the products, and Keq > 1. • The position of the equilibrium is determined by the relative energies of the reactants and products. • G° is the overall energy difference between reactants and products.
Figure 6.3 Summary of the relationship between ∆G° and Keq
G° is related to the equilibrium constant Keq by the following equation: • When Keq > 1, log Keq is positive, making G° negative, and energy is released. Thus, equilibrium favors the products when the energy of the products is lower than the energy of the reactants. • When Keq < 1, log Keq is negative, making G° positive, and energy is absorbed. Thus, equilibrium favors the reactants when the energy of the products is higher than the energy of the reactants.
Compounds that are lower in energy have increased stability. • The equilibrium favors the products when they are more stable (lower in energy) than the starting materials of a reaction. • Because G° depends on the logarithm of Keq, a small change in energy corresponds to a large difference in the relative amount of starting material and product at equilibrium.
These equations can be used for any process with two states in equilibrium. As an example, monosubstituted cyclohexanes exist as two different chair conformations that rapidly interconvert at room temperature, with the conformation having the substituent in the roomier equatorial position favored. • Knowing the energy difference between two conformations permits the calculation of the amount of each at equilibrium.
Enthalpy and Entropy • G° depends on H° and the entropy change, S°. • Entropy change, S°, is a measure of the change in the randomness of a system. The more disorder present, the higher the entropy. Gas molecules move more freely than liquid molecules and are higher in entropy. Cyclic molecules have more restricted bond rotation than similar acyclic molecules and are lower in entropy. • S° is (+) when the products are more disordered than the reactants. S° is (-) when the products are less disordered than the reactants. • Reactions resulting in increased entropy are favored. • G°is related to H° and S° by the following equation:
This equation indicates that the total energy change is due to two factors: the change in bonding energy and the change in disorder. • The change in bonding energy can be calculated from bond dissociation energies. • Entropy changes are important when • The number of molecules of starting material differs from the number of molecules of product in the balanced chemical equation. • An acyclic molecule is cyclized to a cyclic one, or a cyclic molecule is converted to an acyclic one.
In most other reactions that are not carried out at high temperature, the entropy term (TS°) is small compared to the enthalpy term (H0), and therefore it is usually neglected.
Energy Diagrams • An energy diagram is a schematic representation of the energy changes that take place as reactants are converted to products. • An energy diagram plots the energy on the y axis versus the progress of reaction, often labeled as the reaction coordinate, on the x axis. • The energy difference between reactants and products is H°. If the products are lower in energy than the reactants, the reaction is exothermic and energy is released. If the products are higher in energy than the reactants, the reaction is endothermic and energy is consumed. • The unstable energy maximum as a chemical reaction proceeds from reactants to products is called the transition state. The transition state species can never be isolated. • The energy difference between the transition state and the starting material is called the energy of activation, Ea.
For the general reaction: • The energy diagram would be shown as:
The energy of activation is the minimum amount of energy needed to break the bonds in the reactants. • The larger the Ea, the greater the amount of energy that is needed to break bonds, and the slower the reaction rate. • The structure of the transition state is somewhere between the structures of the starting material and product. Any bond that is partially formed or broken is drawn with a dashed line. Any atom that gains or loses a charge contains a partial charge in the transition state. • Transition states are drawn in brackets, with a superscript double dagger (‡).
Figure 6.4 Some representative energy diagrams Example 1
Figure 6.4 Some representative energy diagrams Example 2
Figure 6.4 Some representative energy diagrams Example 3
Figure 6.4 Some representative energy diagrams Example 4
Figure 6.5 Comparing ∆H° and Ea in two energy diagrams
Consider the following two step reaction: • An energy diagram must be drawn for each step. • The two energy diagrams must then be combined to form an energy diagram for the overall two-step reaction. • Each step has its own energy barrier, with a transition state at the energy maximum.