Download

1 / 57
600 likes | 873 Views
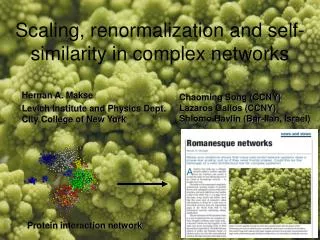
Networks and Scaling. Distributions and Scaling. What is a numerical distribution ? What is scaling ?. Example: Human height follows a normal distribution. Frequency. Height. http://scienceblogs.com/builtonfacts/2009/02/the_central_limit_theorem_made.php.

E N D
Distributions and Scaling • What is a numerical distribution? • What is scaling?
Example: Human height follows a normal distribution Frequency Height http://scienceblogs.com/builtonfacts/2009/02/the_central_limit_theorem_made.php
Example: Population of cities follows a power-law (“scale-free) distribution http://upload.wikimedia.org/wikipedia/commons/4/49/Powercitiesrp.png http://www.streetsblog.org/wp-content/uploads 2006/09/350px_US_Metro_popultion_graph.png http://cheapukferries.files.wordpress.com/2010/06/hollandcitypopulation1.png
part of WWW Number of nodes Number of nodes Degree Degree
The Web’s approximate Degree Distribution “Scale-free” distribution Number of nodes “power law” Degree
The Web’s approximate Degree Distribution “Scale-free” distribution Number of nodes “power law” Degree
log (Number of nodes) Number of nodes Degree k log (Degree) A power law, plotted on a “log-log” plot, is a straight line. The slope of the line is the exponent of the power law. From http://www.pnas.org/content/105/37/13724/F4.expansion.html
Other examples of power laws in natureGutenberg-Richter law of earthquake magnitudes By: Bak [1]
Rank-frequency scaling: Word frequency in English (Zipf’s law) A plot of word frequency of single words (unigrams) versus rank r extracted from the one million words of the Brown’s English dictionary. (http://web.me.com/kristofferrypdal/Themes_Site/Scale_invariance.html)
Rank-frequency scaling: City populations http://brenocon.com/blog/2009/05/zipfs-law-and-world-city-populations/
From A Unified Theory of Urban Living, L. Bettencourt and G. West, Nature, 467, 912–913, 2010 Scaling in cities
http://mjperry.blogspot.com/2008/08/more-on-medal-inequality-at-2008.htmlhttp://mjperry.blogspot.com/2008/08/more-on-medal-inequality-at-2008.html
In-class exercise: Benford’s Law • City populations http://www.census.gov/population/www/documentation/twps0027/tab22.txt
Benford’s law: Distribution of leading digits http://www.youtube.com/watch?v=O8N26edbqLM Newcomb’s observation Explanation of Benford’s law?
Collect distribution of leading digits in corporate accounting statements of total assets Plot deviations from Benford’s law versus year http://econerdfood.blogspot.com/2011/10/benfords-law-and-decreasing-reliability.html
“Bernie vsBenford’s Law: Madoff Wasn’t That Dumb” http://paul.kedrosky.com/archives/2008/12/bernie_vs_benfo.html Frequency of leading digits in returns reported by Bernie Madoff’s funds
Controversy: Can Network Structure and Dynamics Explain Scaling in Biology and Other Disciplines? Scaling: How do properties of systems (organisms, economies, cities) change as their size is varied? Example: How does basal metabolic rate (heat radiation) vary as a function of an animal’s body mass?
Metabolic scaling • Surface hypothesis: • Body is made of cells, in which metabolic reactions take place. • Can “approximate” body mass by a sphere of cells with radius r. • Can approximate metabolic rate by surface area r
Mouse Hamster Hippo
Mouse Hamster Radius = 2 Mouse radius Hippo Radius = 50 Mouse radius
Mouse Hamster Radius = 2 Mouse radius Hippo Radius = 50 Mouse radius Hypothesis 1: metabolic rate body mass
Mouse Hamster Radius = 2 Mouse radius Hippo Radius = 50 Mouse radius Hypothesis 1: metabolic rate body mass Problem: Mass is proportional to volume of animal but heat can radiate only from surface of animal
Mouse Hamster Radius = 2 Mouse radius Volume of a sphere: Surface area of a sphere: Hippo Radius = 50 Mouse radius Hypothesis 1: metabolic rate body mass Problem: mass is proportional to volume of animal but heat can radiate only from surface of animal
Mouse Hamster Radius = 2 Mouse radius Mass 8 Mouse radius Surface area 4 Mouse radius Volume of a sphere: Surface area of a sphere: Hippo Radius = 50 Mouse radius Hypothesis 1: metabolic rate body mass Problem: mass is proportional to volume of animal but heat can radiate only from surface of animal
Mouse Hamster Radius = 2 Mouse radius Mass 8 Mouse radius Surface area 4 Mouse radius Volume of a sphere: Surface area of a sphere: Hippo Radius = 50 Mouse radius Mass 125,000 Mouse radius Surface area 2,500 Mouse radius Hypothesis 1: metabolic rate body mass Problem: mass is proportional to volume of animal but heat can radiate only from surface of animal
“Volume of a sphere scales as the radius cubed” “Surface area of a sphere scales as the radius squared” Volume of a sphere: Surface area of a sphere: Surface area scales with volume to the 2/3 power. mouse hamster (8 mouse mass) hippo (125,000 mouse mass)
“Volume of a sphere scales as the radius cubed” “Surface area of a sphere scales as the radius squared” Volume of a sphere: Surface area of a sphere: Surface area scales with volume to the 2/3 power. Hypothesis 2 (“Surface Hypothesis): metabolic rate mass2/3 mouse hamster (8 mouse mass) hippo (125,000 mouse mass)
y = x2/3 log (metabolic rate) log (body mass)
Actual data: y = x3/4
Actual data: y = x3/4 Hypothesis 3 (“Keiber’s law): metabolic rate mass3/4
Actual data: y = x3/4 Hypothesis 3 (“Keiber’s law): metabolic rate mass3/4 For sixty years, no explanation
y = x2/3 y = x3/4 More “efficient”, in sense that metabolic rate (and thus rate of distribution of nutrients to cells) is larger than surface area would predict. metabolic rate body mass
Other Observed Biological Scaling Laws Heart rate body mass1/4 Blood circulation time body mass1/4 Life span body mass1/4 Growth rate body mass1/4 Heights of trees tree mass1/4 Sap circulation time in trees tree mass1/4
West, Brown, and Enquist’s Theory(1990s) General idea: “metabolic scaling rates (and other biological rates) are limited not by surface area but by rates at which energy and materials can be distributed between surfaces where they are exchanged and the tissues where they are used. “ How are energy and materials distributed?
West, Brown, and Enquist’s Theory(1990s) • Assumptions about distribution network: • branches to reach all parts of three-dimensional organism (i.e., needs to be as “space-filling” as possible) • has terminal units (e.g., capillaries) that do not vary with size among organisms • evolved to minimize total energy required to distribution resources
Prediction: Distribution network will have fractal branching structure, and will be similar in all / most organisms (i.e., evolution did not optimize distribution networks of each species independently) • Therefore, Euclidean geometry is the wrong way to view scaling; one should use fractal geometry instead! • With detailed mathematical model using three assumptions, they derive metabolic rate body mass3/4
Their interpretation of their model • Metabolic rate scales with body mass like surface area scales with volume... but in four dimensions.