Download
1 / 4
40 likes | 248 Views
Yellow House. Purple House. Red House. In total there were 8 house points – 4 of those went to Red House, 2 went to Purple House and 2 went to Yellow House. We could write this as 4 out of 8 were Red or half of them were Red.

E N D
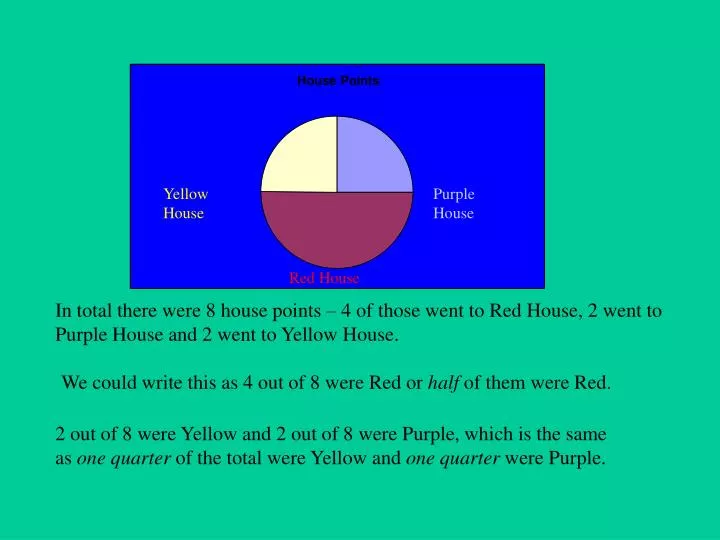
Yellow House Purple House Red House In total there were 8 house points – 4 of those went to Red House, 2 went to Purple House and 2 went to Yellow House. We could write this as 4 out of 8 were Red or half of them were Red. 2 out of 8 were Yellow and 2 out of 8 were Purple, which is the same as one quarter of the total were Yellow and one quarter were Purple.
This time the children have been asked to make a Pie Chart for a data group that has 20 people in total, 10 who like cake, 4 who like Apple Pie, 5 who like trifle and 1 who likes sticky pudding. The children’s Pie Chart is below but which part belongs to which group?
A Pie Chart has been made below but the information has gone missing from two segments of the Pie Chart. Can you work out the missing details and then explain how you found them? Mr Catch 5 Mrs Astitch 10 Mrs Herbus Mrs Hermum Mr. Painter 50
You have a group of data to put into a Pie Chart: Lemonade 15; Cola 10; Cherry 5; Pepsi 20; Fanta 10 Explain how you would do it and then draw in the different segments of the Pie Chart