Download
1 / 49
490 likes | 543 Views
Microminerals/Trace Elements Minerals that comprise < 0.01% of the body weight Needed in concentrations of 1 PPM (part per million) or less; < 100 mg needed per day RDAs have been established for 6 of these elements Iron, zinc, copper, iodine, selenium, and molybdenum

E N D
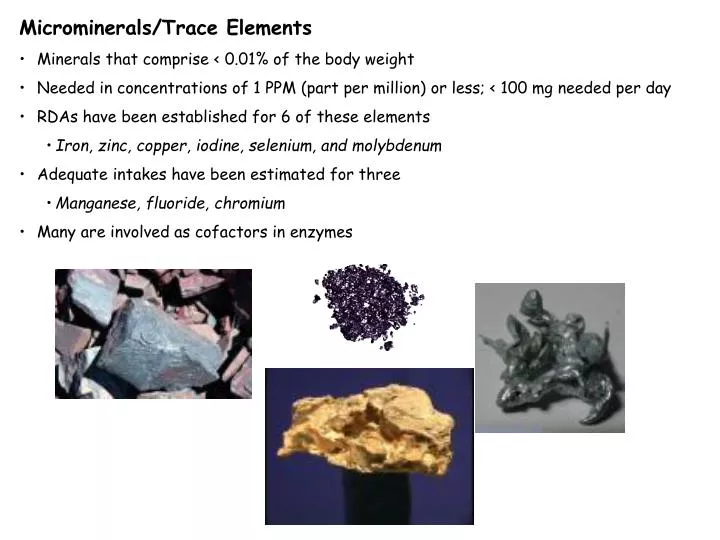
Microminerals/Trace Elements • Minerals that comprise < 0.01% of the body weight • Needed in concentrations of 1 PPM (part per million) or less; < 100 mg needed per day • RDAs have been established for 6 of these elements • Iron, zinc, copper, iodine, selenium, and molybdenum • Adequate intakes have been estimated for three • Manganese, fluoride, chromium • Many are involved as cofactors in enzymes
Iron • Ferric (3+) and ferrous (2+) forms the only oxidation states found in the body and in food. • Food forms are either heme or non-heme iron • Heme forms (derived from hemoglobin and myoglobin) are found mostly in animal products • Non-heme forms are principally found in plants and require more digestion prior to absorption; supplements are generally nonheme iron • Many foods are fortified with iorn including flour, corn meal, and rice. Table 12-2, p. 419
“Good” chelators: Acids (ascorbic, citric, tartaric); sugars; meat products; mucin “Inhibitors”: polyphenols such as those found in coffee and tea; oxalic acid; phytates; EDTA; calcium, zinc, manganese, nickel Fig. 12-2, p. 421
Cellular iron influences the synthesis of apoferritin at the translation level. Release of iron from stores requires mobilization of Fe3+ and the use of reducing substances such as riboflavin, niacin, and/or vitamin C . Uptake by tissues depends on the transferrin saturation level and the presence of a tranferrin receptor (TfR2) on the cell Fig. 12-4, p. 426
Functions: • Energy Production • In heme proteins - hemoglobin, myoglobin, cytochromes, In iron-sulfur proteins - several in electron transport chain, aconitase and ferrochelatase • Other Enzymes • monooxygenases, dioxygenases, and oxidases, • aconitase (krebs cycle) • Peroxidases • oxidoreductases • Ribonucleotide reductase • Glycerolphosphate dehydrogenase Fig. 12-5, p. 428
Daily needs cannot be met by absorbed iron. Therefore, it is highly conserved and recycled. Losses are from GI tract, skin, kidney Fig. 12-6, p. 432
Deficiency: Iron Deficiency and Iron Deficiency Anemia Fig. 12-7, p. 433
Zinc • Found in all organs and tissues; highest in bone, liver, kidney, muscle and skin • Can exist in different valence states but in the body is always found in its divalent form (Zn2+) • Found in many sources, but zinc from plant sources is lower in content and not as easily absorbed as Zn associated with meat. Table 12-3, p. 436
Enhancers of absorption: citric acid, picolinic acid, histidine, cysteine, glutathione, low zinc status Inhibitors: phytate, oxalate, polyphenols, fibers, folic acid, divalent cations Fig. 12-8, p. 438
Carbonic anhydrase Alkaline phosphatase Alcohol dehydrogenase Superoxide dismutase Involved in at least 70 and probably as many as 200 different reactions. Is a part of more enzyme systems than all the other trace elements combined. Table 12-4, p. 441