Download
1 / 25
250 likes | 425 Views
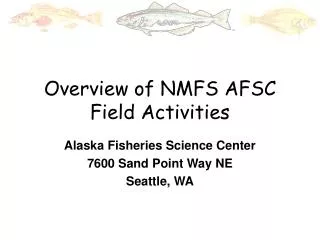
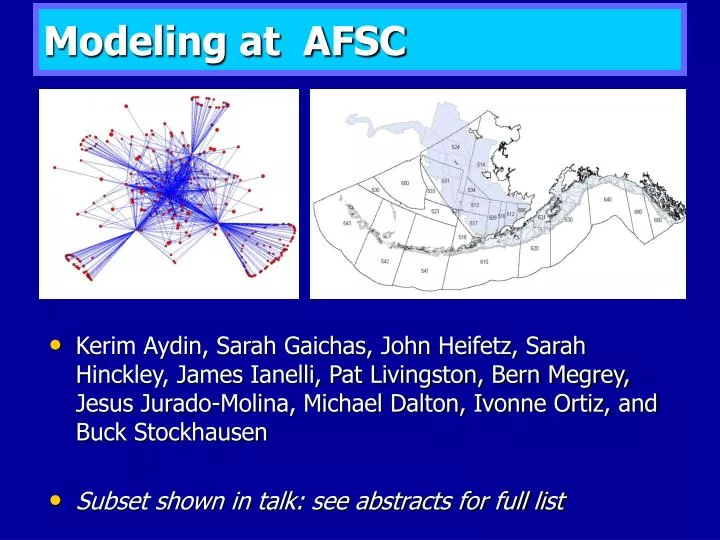
Modeling at AFSC. Kerim Aydin, Sarah Gaichas, John Heifetz, Sarah Hinckley, James Ianelli, Pat Livingston, Bern Megrey, Jesus Jurado-Molina, Michael Dalton, Ivonne Ortiz, and Buck Stockhausen Subset shown in talk: see abstracts for full list.

E N D
Modeling at AFSC • Kerim Aydin, Sarah Gaichas, John Heifetz, Sarah Hinckley, James Ianelli, Pat Livingston, Bern Megrey, Jesus Jurado-Molina, Michael Dalton, Ivonne Ortiz, and Buck Stockhausen • Subset shown in talk: see abstracts for full list
M. Litzow and J. Short, NOAA Alaska Fisheries Science Center Feely et al. 2004. Impact of anthropogenic CO2 on the CaCO3 in the oceans. Science 305: 362-366. Two major scales of modeling • Long-term (50+year) predictions • Driven by Climate Change predictions: LOSS OF SEA ICE and OCEAN ACIDIFICATION: Primarily Biophysical->fish models (bottom-up) • Interface with current management • Folding currently operational models in with the stock assessment and Council processes: MRM and ecosystem models
NEMURO:North Pacific Ecosystem Model for Understanding Regional Oceanography “A conceptual model representing the minimum trophic structure and biological relationships between and among all the marine ecosystem components thought to be essential to describe ecosystem dynamics in the North Pacific” (An MRM for NPZ modeling?) Shown is NEMURO.FISH extension Source: Megrey et al. 2007
Marine Seas where the NEMURO Model has been Applied Prince William Sound Sea of Okhotsk West Coast Vancouver Island Bering Sea Hokkaido Island Station P Yellow Sea Aegean Sea California Current East China Sea Gulf of California
Central Alaskan Pink Japanese Chum Western Alaskan Sockeye British Columbia Sockeye Pink salmon bioenergetics model, predicts daily pink salmon growth and numerical mortality based on input ration. Pink salmon body weight and numbers used to set Ecosim biomass for predator and prey equations in next timestep. Consumption and mortality rates for Pink salmon based on predator and prey biomass. Ecosim (ecosystem biomass dynamics model), run on a daily timestep. • Predicted effect of climate change on pink salmon growth: • 10% increase in water temperature leads to 3% drop in mature salmon body weight (physiological effect). • 10% decrease in pteropod production leads to 20% drop in mature salmon body weight (prey limitation). Daily biomass density of phytoplankton, microzooplankton, large zooplankton (copepods). NEMURO (nutrient-phytoploankton-zooplankton-detritus): 1-dimensional water column model integrated on an hourly timestep. (Aydin et al. 2005)
DisMELS: Dispersal Modeling for Early Life Stages (Stockhausen) Larvae have behavior! preferred night time depth range preferred daytime depth range + Growth, Mortality
ROMS 3D Hydrodynamic Model Output IBM for Early Life History Stages DisMELS and ROMS(one of multiple efforts interfacing with ROMS) (A. Hermann) Egg Stage 1 Egg Stage N Larval Stage 1 Larval Stage M
PET-ISAM Model for Integrated Assessment PET Model CO2 Emissions • Population-Environment-Technology Model coupled to Integrated Science Assessment Model • ISAM used to analyze climate change and ocean acidification (Cao, Caldeira & Jain, GRL 2007)
AIM: Coupled PET-ISAM-EwE ISAM EwE/ Ecosense Households Capital & Labor Consumption & Savings Climate K & L C & I CO2, GHGs Seafood Final Goods Producers Consumption Investment Government Exports & Imports Intermediate goods producers Agriculture Fisheries Forests Energy Everything Else (ETE) E & M
Integration with management • Conservative exploitation rates/productive stocks (unless you’re a crab). • Declining mammal and bird stocks (fisheries management with Endangered Species Act considerations) • Pro-active management: ecosystem committee, ecosystem considerations chapter, but also pro-active lawsuits • Recent declines in most valuable fishery, the walleye pollock (CASE STUDY for both strategic and tactical integration) • Steller Sea Lions • Aleutian Islands Fisheries Ecosystem Plan
“This” generation • Multispecies Bycatch Model: • Technical (Gear) interactions, age structured with detailed management scenarios, no predator/prey links • MSVPA/MSFOR/MSM/MAMAK • Multispecies age structured predator/prey for 7 target species, adds explicit predation effects to recruitment hindcasts • Ecopath/Ecosim • Includes non-target and protected species dynamics, gear, limited age structure (primarily biomass dynamics) • An “operational ensemble?”
INTEGRATION WITH STOCK ASSESSMENT PROCESS • Initially driven by NEPA, but now strongly positive interactions on all levels • Ecosystem Considerations in each stock assessment • Ecosystem Assessment • Multispecies models • Ecosystem Status Indicators • Ecosystem-Based Mngt Indices
Complexity vs. management reality Eastern Bering Sea Gulf of Alaska
Scoping/strategic analysis GOA predation vs. fishing 2005 Both F and M (Assessment Fig 9)
Strategy implications? Eventual goal. (Fishing+Predation)/ Production
Broad strategic scoping leads to MRMs, and PARAMETER ESTIMATION/VALIDATION MSVPA and Multispecies Statistical Model Fishery Pacific cod Walleye pollock Arrowtooth flounder (Ianelli and Jurado-Molina) MCMC integrated profile of M
MAMAK: Aleutian fisheries 1979-2003 (Kinzey and Punt) • Walleye pollock, Atka mackerel, and Pacific cod provide the basis for the major fisheries of the Aleutian shelf, Alaska. All three species interact as predators and prey. • Type II: asymptotic • Type I: linear • Type III: S-shaped • Type IV: ratio interference • Type V: ratio pre-emption, asymptotic • Type VI: Hassel-Varley • Type VII: “Ecosim” Spawning stock biomass Predation “off”: black dashes Predation “on” Types I-VII functional responses: blue lines
Calculating Ecosim uncertainty (Extended fitting methods applied to multiple functional responses, extended equations, challenging the “primary production anomaly” methodology.) Gaichas and Aydin
Direct “tactical” uses : A Tale of Two Ecosystems Eastern Bering Sea Gulf of Alaska
GOA Long term: MSE • Arrowtooth biomass vs. pollock M • Shrimp biomass vs. pollock M Best fit functional responses (1970-present) dichotomous based on assumed forcing source (e.g. bottom-up vs. arrowtooth larval advection). Method: Test all hypotheses.
This continued low level of forage was (qualitative) reason for caution for pollock discussed by BSAI Plan Team EBS additional concerns: Zooplankgon and forage fish biomass (Assessment Fig. 3)
Evolution of single-species assessments to include advice from multispecies models and indicators From North Pacific Fisheries Management Council’s Scientific and Statistical Committee minutes, December 2006: • “The [eastern Bering Sea walleye pollock] stock remains above the MSY level, having declined … at a rate of about 19% per year….A series of 4 below-average recruitments has contributed to the decline…the series of low recruitments will result in an age-structure that is dominated by only a few year-classes which could increase fluctuations in the population.” • “Other issues raised in the stock assessment suggest a need for further caution.” • a northward shift … with some portion of the population into Russian waters. • a large decline in zooplankton, which is important in providing forage for juvenile pollock. • increasing predation by arrowtooth flounder on juvenile pollock, which could contribute to further declines in adult pollock biomass. • “Consequently, the SSC agrees with the Plan Team that a reduction in Allowable Biological Catch from the maximum permissible is justified.” Result from single-species assessment Assessment + ecosystem indicators Ecosystem indicators A multispecies model
Change shipping routes? Oil spill on rookery Increase Atka fishing? low Impact of interaction high Cod eat Atka low Probability of interaction high KEY IS FOLDING IN TO STOCK ASSESSMENT PROCESS. THIS SYSTEM WORKS WHEN IT IMPACTS A TARGET SPECIES, BUT THERE IS LIMITED MANAGEMENT MANDATE FOR INTERACTIONS. Perhaps Fisheries Ecosystem Plans will create context, avoid crisis mode?