Download

1 / 16
160 likes | 420 Views
Ryan White Part B Quality Management Measures. Virginia Ryan White Data January 1 to December 31, 2008. 5 Quality Management Indicators: January to December 2008. IND1: HIV+ Clients who have 2 or more CD4 counts (and a medical visit) in the 12 month period

E N D
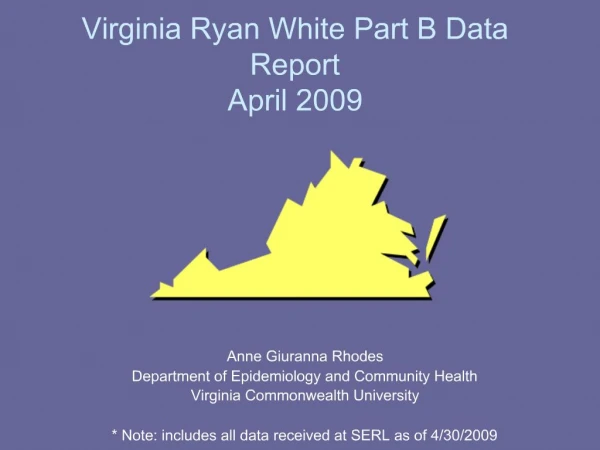
Ryan White Part B Quality Management Measures Virginia Ryan White Data January 1 to December 31, 2008
5 Quality Management Indicators: January to December 2008 • IND1: HIV+ Clients who have 2 or more CD4 counts (and a medical visit) in the 12 month period • IND2:Clients with AIDS (and a medical visit) who are prescribed HAART • IND3: HIV+ Clients with 2 or more medical visits in the 12 month period (of those who had at least one medical visit) • IND4:HIV+ Clients with CD4 Count < 200 who had PCP prophylaxis in 12 month period • IND5: HIV+ Clients who received LTBI results since HIV diagnosis
Indicator 1: 2 or More CD4 Counts in 12 MonthsRegion and State 22.7% of all clients who received a medical service had no CD4 counts reported
Indicator 1: 2 or More CD4 Counts in 12 months Regional Data
Indicator 2: Clients with AIDS prescribed HAART Region and State 16.25% of clients had an unknown AIDS status
Indicator 2: Clients with AIDS prescribed HAART Regional Data
Indicator 3:HIV+ Clients with 2 or more medical visitsRegion and State
Indicator 3: HIV+ Clients with 2 or more Medical Visits Regional Data
Indicator 4: HIV+ Clients with CD4 Count < 200 prescribed prophylaxis, Region and State
Indicator 4: HIV+ Clients with CD4 Counts < 200 prescribed prophylaxis, Regional Data
Indicator 5: HIV+ Clients who received LTBI results since diagnosis, Region and State
Indicator 5: HIV+ Clients who received LTBI results since diagnosis, Regional Data
NEXT STEPS • Each region needs to review this data. • Set up time and date to discuss this baseline data with providers and VDH. • Set goals for the coming months. • Keep working with subcontractors and SERL to improve current data management.