Download
1 / 14
140 likes | 227 Views
Are craters the cause? Are these two ratios equal?. This is NOT a matter of opinion! This is what error analysis is for. Normal (Gaussian) Distribution. Error in a single measurement = e = x – X. = variance. σ = standard deviation of the distribution

E N D
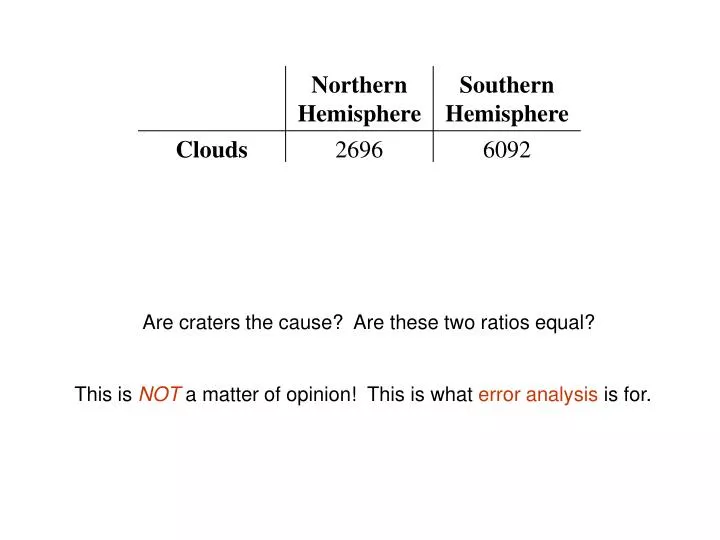
Are craters the cause? Are these two ratios equal? This is NOTa matter of opinion! This is what error analysis is for.
Normal (Gaussian) Distribution Error in a single measurement = e = x – X = variance σ = standard deviation of the distribution = uncertainty in a single measurement
σm = standard error of the mean = uncertainty in mean value after n measurements Error in ith measurement = ei = xi - X Error in the mean = E Thus Experimental results presented as: m = (1.10 +/- 0.04) × 102 kg
Sometimes you’ll see P = (4.30 +/- 0.04sys +/- 0.05stat) × 10-2 W Systematic uncertainty – two ways to take into account: • Given by device documentation • Half of last digit on display • (voltmeter at left: +/- 0.005 V) Can also have a systematic shift (such as a mis-zeroed measuring device) – trickier to handle
Statistical uncertainty – quantity changes from one measurement to next Example: What is my bowling average? 160 169 212 191 178 190 153 144 The problem is that I don’t know the true mean, so how do I find the standard deviation? Residual of the ith measurement Standard deviation of the sample = s:
And using , we find that For my bowling scores, Mean = (160+169+212+191+178+190+153+144)/8 = 174.6 s = sqrt[(160-174.6)2 + (169-174.6)2 + … + (144-174.6)2]/8 = 21.1 σm = sqrt(1/7) * 21.1 = 8.0 Thus my bowling average is 175 +/- 8, or even better, (1.75 +/- 0.08) × 102
Propagation of errors: For a function f(x,y,z), Some common examples: f = x + y OR f = x – y (σf)2 = (σx)2 + (σy)2 f = xy OR f = x/y (σf/f)2 = (σx/x)2 + (σy/y)2 f = xn σf/f = n(σx/x) f = ln x σf = σx/x f = exσf/f = σx
A random process is one in which an observed quantity will be different from moment to moment, such as: • The number of photons emitted by a laser • Decays from a radioactive source Useful rule: If a measurement of a random process is N, the standard error is √N.
Clouds (North) = 2696 +/- √2696 = 2696 +/- 52 Clouds (South) = 6092 +/- √6092 = 6092 +/- 78 Ratio = Clouds / Craters, so σR = σCl/ Craters Ratio (North) = (2696 +/- 52) / 1528 = 1.764 +/- 0.034 Ratio (South) = (6092 +/- 78) / 3156 = 1.930 +/- 0.025 Difference = South – North, so (σDiff)2 = (σS)2 + (σN)2 The difference is 0.17 +/- 0.04, which is not consistent with zero to within three standard deviations. Thus the two ratios are not equivalent, and cratering can not be the sole reason for the discrepancy in cloud formation.
Student’s T-test: a tool for determining the equivalency of two numbers, taking into account sample size and confidence level. • Procedure: • Find the variance in the difference, (σDiff)2 = (σ1)2 + (σ2)2 • Calculate the t value: t = (x1 – x2)/σDiff • Find the number of degrees of freedom, n1 + n2 – 2 • Choose a confidence level (p = 0.05 means 95% probability) • Look up on a t-table; if your t value exceeds the number in the table, the two means are not equivalent.
Example: Earlier we used 8 scores to find my bowling average = 175 +/- 8. Let’s say Joe also bowled 8 games, for an average of 150 +/- 6. Is it 95% probable that I am a better bowler? σDiff = √(62 + 82) = 10 t value = (175 – 150) / 10 = 2.5 # of degrees of freedom = (8 + 8 – 2) = 14 For p = 0.05 and 14 degrees of freedom, the table reads 2.14 < 2.50. Thus the two averages are not equivalent, so I am clearly the superior bowler.
To fit a function to your data, test a range of possibilities for each variable in the function, and choose those which minimize Σ[xi – f(x)]2. This is called least-squares fitting. You can also perform a weighted fit by applying a coefficient to each term which scales inversely with the size of the error bar (the larger the error bar, the smaller the coefficient, and the less effect the point has on the fit): Σai[xi – f(x)]2.
Useful references: • Practical Physics, 4th ed. by G. L. Squires • http://davidmlane.com/hyperstat/ • Data analysis functions in Excel, Matlab • Your tutors or Sheets, for other software applications • Your mentor! The MOST IMPORTANT thing to draw from this session: Much of science is comparing experiment and theory, or quantity A to quantity B. Proper error analysis gives you a systematic way to determine if two numbers agree or disagree, and makes your paper much more convincing.