Download
1 / 9
90 likes | 504 Views
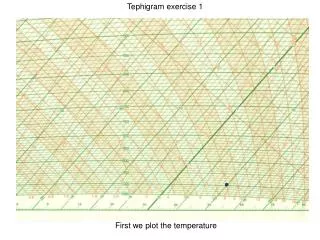
Use of the Tephigram. 700. 800 . Lifting condensation level, LCL. 900. 1000. Path of air parcel on tephigram. Parcel initially at: 30 °C, dew point 14°, pressure 1000 mb. We can see that this corresponds to w = 10 g kg -1 As parcel ascends: T follows dry adiabatic

E N D
700 800 Lifting condensation level, LCL 900 1000 Path of air parcel on tephigram Parcel initially at: 30°C, dew point 14°, pressure 1000 mb. We can see that this corresponds to w = 10 g kg-1 As parcel ascends: T follows dry adiabatic Mixing ratio is constant until saturation (T = TD) Then parcel follows saturated adiabatic
“Normand’s Theorem” Wet bulb potential temperature, θW is used to label saturated adiabats (value of T where adiabat crosses 1000 mb) Project the saturated adiabatic to 1000 mb. It is colder than the (unsaturated) temperature because water is evaporated into the air to keep it saturated, and the energy comes from the air. This is the definition of the wet bulb temperature. 700 800 LCL 900 1000 TW TD T Dry adiabatic through the temperature, the mixing ratio line through the dew point, and the saturated adiabatic through the wet bulb temperature, all meet at the LCL
Early morning tephigram over land Tropopause Boundary layer top Radiation inversion
Mixing out of radiation inversion – solar heating at the ground Cloud top Cumulus layer LCL
Energy = area on tephigram. What happens if something pushes air parcel upwards? Convective available potential energy = area where Tparcel>Tenvironment Level of free convection Convective inhibition = area where Tparcel<Tenvironment
Deep convection • Develops when CIN is small and CAPE is large • Need some CIN otherwise there is no ‘build-up’ of energy in the boundary layer • Mechanical forcing often needed to overcome CIN – e.g. flow over mountain, sea breeze, cold front • At other times large-scale forcing e.g. trough provides lift.
Orographic uplift – lift each point on tephigram by 50 mb Coloured dots and lines – initital and final positions of air parcels Grey line – final temperature profile Dark Grey – saturated segment (hill fog) Cloud At each point on the profile: No cloud Cloud forms
Potential Instability Grey line: temperature profile lifted 50 mb Orange line: SALR from uplifted surface air Slope of grey line > SALR so convectively unstable where saturated: deep thunderstorms would occur on this day over a small hill Saturation