Download
1 / 16

E N D
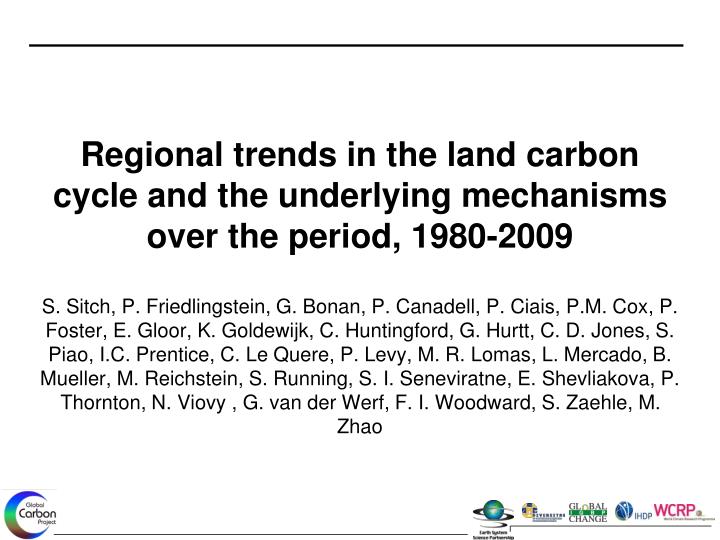
Regional trends in the land carbon cycle and the underlying mechanisms over the period, 1980-2009S. Sitch, P. Friedlingstein, G. Bonan, P. Canadell, P. Ciais, P.M. Cox, P. Foster, E. Gloor, K. Goldewijk, C. Huntingford, G. Hurtt, C. D. Jones, S. Piao, I.C. Prentice, C. Le Quere, P. Levy, M. R. Lomas, L. Mercado, B. Mueller, M. Reichstein, S. Running, S. I. Seneviratne, E. Shevliakova, P. Thornton, N. Viovy , G. van der Werf, F. I. Woodward, S. Zaehle, M. Zhao
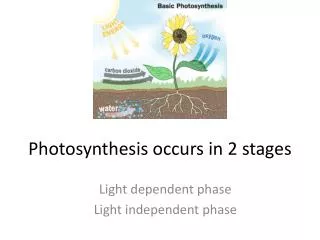
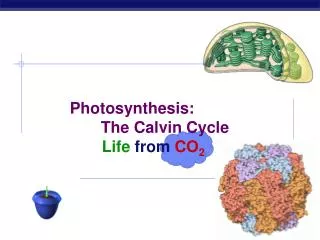
Terminology RH - NPP Net ecosystem exchange NEE Photosynthesis CO2 Gross Primary productivity (GPP)= Photosynthesis +leaf respiration Net Primary productivity (NPP)= GPP-Plant respiration Plant respiration CO2 CO2 Soil respiration (heterotrophic) RH
Key Diagnostic of the Carbon Cycle Evolution of the fraction of total emissions that remain in the atmosphere 10 Total CO2 emissions 8 CO2 Partitioning (PgC y-1) 6 Atmosphere 4 2 1970 1980 2010 2000 1960 1990 Data: NOAA, CDIAC; Le Quéré et al. 2009, Nature-geoscience
1.4 PgC y-1 4.1 PgC y-1 45% 3.0 PgC y-1 29% + 7.7 PgC y-1 26% 2.3 PgC y-1 Fate of Anthropogenic CO2 Emissions (2000-2008) Le Quéré et al. 2009, Nature-geoscience; Canadell et al. 2007, PNAS, updated
Modelled Natural CO2 Sinks Le Quéré et al. 2009, Nature-geoscience
Regional Trends in C-sinks and Annual Global Budget • Global Annual Budget • Regional Trends in Land C-Sinks (Trendy) • Compare DGVM-based estimates with other evidence - Satellite derived data - Fluxtower data - Atmospheric Monitoring Stations
Trendy Protocol GCP- Land trends: modelling protocol Contact: Stephen Sitch (s.sitch@leeds.ac.uk) & Pierre Friedlingstein (pierre.friedlingstein@bristol.ac.uk) Goal: To investigate the trends in NEE over the period 1980-2009 Participating models JULES, LPX, ORCHIDEE, O-CN, HyLand, SDGVM, NCAR CLM4, GFDL/Princeton Model simulations The models will be forced over the 1860-2009 period with changing CO2, climate (CRU/NCEP) and land use: S1: CO2 only S2: CO2 and climate S3 (optional): CO2, climate and land use
Trends in Land Processes Land Source trend positive NPP trend < positive RESP trend negative NPP trend < negative RESP trend negative NPP trend, positive RESP trend Land Sink trend positive NPP trend > positive RESP trend negative NPP trend > negative RESP trend positive NPP trend, negative RESP trend
Climatic Drivers of Trends in Land Processes Land Sink trend positive NPP trend > positive RESP trend negative NPP trend > negative RESP trend positive NPP trend, negative RESP trend Land Source trend positive NPP trend < positive RESP trend negative NPP trend < negative RESP trend negative NPP trend, positive RESP trend
Satellite Evidence: Trends in Soil Moisture B. Mueller, ETH Zurich
DGVM sink vs MODIS-NPP) M Zhao
Alternative Upscaling Approaches Multidimensional flux patterns... forestinventoryplot century Forest/soil inventories Color: GPP decade Landsurface remote sensing Eddycovariancetowers talltowerobser- vatories remote sensingof CO2 year Temporal scale month week day hour ... models to be cross-evaluated against. local 0.1 1 10 100 1000 10 000 global plot/site Countries EU Spatial scale [km] Reichstein
Future Precipitation Changes (Summer Droughts?) JJA http://www.ipcc.ch/ Stippled areas > 90% of the models agree in the sign of the change
Summary • Use set-up to produce global/regional annual C-budgets • Drought may be an important driver of the present-day trends in the land carbon cycle • Climate Models Project Summer Drought in Continental Regions • Drought may be an important driver of the future trends in the land carbon cycle • Critical to understand Ecosystem Response to Drought for future Earth System feedbacks