Download
1 / 21
220 likes | 313 Views
Trend analysis of indicators on Food security for Pakistan. Availability. Access. DETERMINANT Analysis of physical access. Access. DETERMINANT Analysis of economic access. Access. OUTPUT Prevalence of undernourishment. Access. OUTPUT Depth of food deficit. Utilization. DETERMINANT.

E N D
Access DETERMINANT • Analysis of physical access
Access DETERMINANT • Analysis of economic access
Access OUTPUT • Prevalence of undernourishment
Access OUTPUT • Depth of food deficit
Utilization DETERMINANT
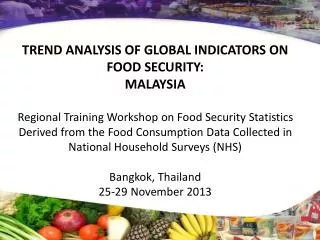
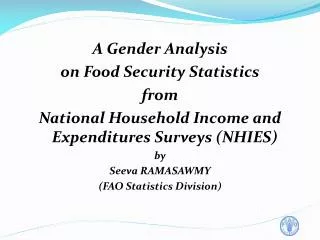
Analysis of micro indicators on food security(Using Household Income Expenditure Survey 2010-11)
Analysis of parameters to determine PoU • Prevalance of Undernourishment (PoU) • Dietary Energy Consumption(DEC) • Dietary Energy Supply (DES) • Minimum Dietary Energy Requirement(MDER)
Analysis of Depth of food deficit *calories required to uplift the undernourised
HIES (2010-11) • Total Sample Size 16341 HH • Survey period 2010-11 (July 2010 to June 2011) • Reference period of food data - Last 14 days for Essential daily use items (like potatoes, apple, perishable items) - Last one month for other food items
HIES (2010-11) • Number of Food items 68 • Quantities (Grams, Kg, Litre, Number) (but converted in gm/ml for food security indicators using Standard density conversion factors) • Values in Pakistani Rupee
Limitations & Recommendations based on the Food Security Data
Limitations • Quantities are in local units, • In Survey food items list is not specific, but in the forms of group like “Wheat & Wheat Flour” • Scope of the survey does not include the Tribal areas, Azad Jammu Kashmir & GilgitBaltistan
Recommendations • In Survey, Food items list should be revised and items must be specific • Scope of the survey should cover entire country • Workshop has made us realize at policy making, that broad brushed policies should be replaced with policies based on real time Food security indicators.P • PoU in urban area is higher than rural, so attention may be given to Urban areas. • Special incentives to agriculture development in Sindh (Watan Card Scheme) • Awareness campaign for healthy and protein rich diet