Download
1 / 24
240 likes | 338 Views
SEASONAL VARIABILITY OF ORGANIC MASS CONTRIBUTION TO PM2.5 WITHIN METRO ATLANTA AND FURTHER DOWNWIND. Acknowledgement: S. Lee, H. Park, M. Bergin, R. Weber, all GA Tech Funding provided by US-EPA and GA-EPD (FAQS). K. Baumann 1 , M.E. Chang 1 , A.G. Russell 2 , E.S. Edgerton 3

E N D
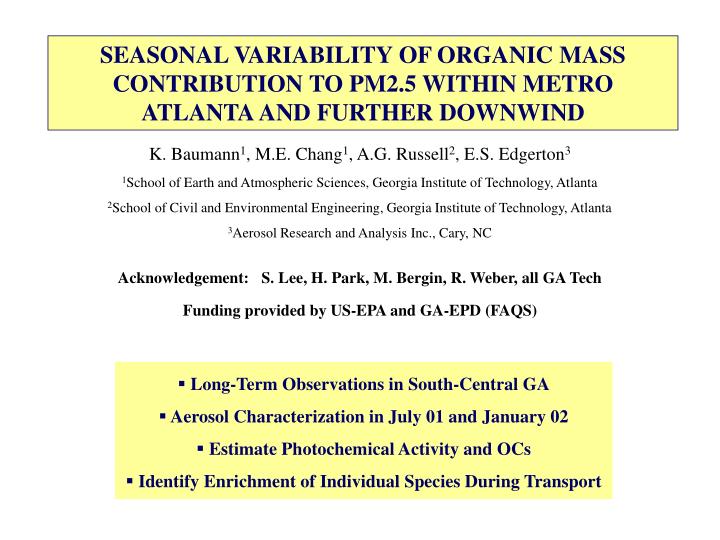
SEASONAL VARIABILITY OF ORGANIC MASSCONTRIBUTION TO PM2.5 WITHIN METROATLANTA AND FURTHER DOWNWIND Acknowledgement: S. Lee, H. Park, M. Bergin, R. Weber, all GA Tech Funding provided by US-EPA and GA-EPD (FAQS) K. Baumann1, M.E. Chang1, A.G. Russell2, E.S. Edgerton3 1School of Earth and Atmospheric Sciences, Georgia Institute of Technology, Atlanta 2School of Civil and Environmental Engineering, Georgia Institute of Technology, Atlanta 3Aerosol Research and Analysis Inc., Cary, NC • Long-Term Observations in South-Central GA • Aerosol Characterization in July 01 and January 02 • Estimate Photochemical Activity and OCs • Identify Enrichment of Individual Species During Transport
GRF FAQS Period Jul’00 - Sep’03 MAY - OCT NOV – APR JST Period AUG’99 Network Measurement Sites, SO2
GRF FAQS Period Jul’00 - Sep’03 MAY - OCT NOV – APR JST Period AUG’99 GRF CO GRF
GRF GRF FAQS Period Jul’00 - Sep’03 MAY - OCT NOV – APR JST Period AUG’99 GRF GRF NOy GRF
GRF GRF FAQS Period Jul’00 - Sep’03 MAY - OCT NOV – APR JST Period AUG’99 GRF GRF O3 GRF
GRF GRF FAQS Period Jul’00 - Sep’03 MAY - OCT NOV – APR JST Period AUG’99 GRF GRF PM2.5 GRF
Summertime PM2.5 – Max(O3) Relationship Tighter correlation in July 2001. “Downwind” Griffin site offset to higher PM2.5 mass. What was different in August 1999?
> 117,000 37,320 16,250 16 6 40 15 = OC/EC ratio Prescribed Burns in Georgia EF(OC) ~ 10 g/kg EC/CO ~ 0.4 ±0.2 flaming ~ 3.3 ±0.7 smolder OM/OC ~ 1.5 ±0.7 . . OC/EC ~ 16 ±18 See Lee et al., 13A3 on Wednesday !!
Urban / Rural Seasonal Trend in OC/EC and OM/OC Regional Difference: Higher OM/OC and OC/EC at more rural site. More OCs (SOA) in Aug-99 and more oxygenated POC away from Atlanta. Seasonal Difference: Lower OM/OC and higher (?) OC/EC in winter. August 1999 in Atlanta was hotter, dryer, more polluted (incl. NH3?).
Atlanta Jeff. St. N 50 km S Griffin Bledsoe Farm July 2001 Source - Receptor Considerations: The Big Picture
July 2001 Source – Receptor Considerations: CO/NOy downwind Higher intercept points to elevated regional background CO! Long-range transport of wild fire plumes from Canada (see SOS’95) or effect from more local PB within GA? Air mass arriving at Griffin has significantly higher CO/NOy ratio in summer than in winter: Loss of more abundant summertime HNO3 due to surface deposition!
downwind July 2001 Source – Receptor Considerations: O3/NOz as “OPE” Elevated regional O3 background reflected in regression’s intercept: higher in Aug 99! At JST higher intercept and slope during Aug ’99 (OPE= 4 vs 3): more efficient P(O3). OPE in air mass arriving at Griffin is likely larger given by upper and lower limits. Lower limit assumes 1st order loss of HNO3 due to surface deposition at k ≈ 0.3 ±0.1 h-1, which is similar to recent study [Neuman et al., 2004] but signif. higher than prev. derived from vdep.
July 2001 Source – Receptor Considerations: Primary OC Using EC-Tracer approach [Gray 1986, Turpin et al. 1996, Cabada et al. 2002]: OCs = OC – OCp, with OCp = (OC/EC)p * EC + b Careful selection of days (samples) dominated by primary pollution using photochemical tracers incl. aerosol acidity yields: Non-combustion (biogenic?) contribution b seems spatially and seasonally independent. (OC/EC)p significantly higher at more rural GRF site at all times.
Seasonal Comparison of Estimated Secondary OC Assuming (OC/EC)p and b constant for Atlanta JST site and applying derived values from Jul-01 data, OCs/OC varies between 64 and 70 % in Aug-99, depending on TOT or Relative Reference data. OCs fraction was significantly less at JST in Jul-01 between 14 % for northerly flow, and 10 % for all other flow conditions. The GRF site’s OCs/OC is significantly larger than JST’s but remains ~50 % whether downwind from JST or not. The high OCs/OC at GRF in Jan-02 under non-NF is accompanied by large OC/EC (19 ±9) and small EC/CO (0.6 ±0.1 mg/mg), indicating a possible influence from prescribed burning (days and locations not confirmed yet).
Seasonal Differences in Source – Receptor Relationships Comparing days when GRF was predominantly under N-ly flow, i.e. downwind from JST. High P(O3) and OPE leads to high OM/OC (>2) region wide, but >30 % more OCs/OC and higher aerosol acidity (ammonium, sulfate, nitrate system) at receptor. EC/CO sensitive to TOR vs. TOT, but source receptor gradient and seasonal difference may be due to different fuel mix; e.g. residential wood & prescribed burning. Slightly more NO3- formed than SO4= by time the air mass arrives at GRF in summer, and %-nitrate of N(V) reservoir increased also due to apparent HNO3 deposition. Strong change in acidic aerosol products from more nitrate in urban center to more sulfate in rural downwind site under simultaneous increase in %-ammonium of N(-III) reservoir.
CO-referenced “Enrichment Factors” CO was used due to lack of another more suitable tracer, e.g. Na+, or Al2O3 Ammonium sources and sinks balance in summer, sinks dominate in winter. Nitrate sources enhanced in winter due to reduced HNO3 volatility (ambient RH at GRF reaches DRH and NH3*HNO3 high enough to sustain solid NH4NO3 most days. N(V) reservoir almost balanced in summer but sinks dominate in winter. S-compounds “enriched” due to coal PP emissions sources but highly variable due to limited data set; photochemical sulfate source ineffective in winter. Biogenic (?) LOA sources enhanced by photochemical sources in summer; sources and sinks almost balanced in winter with slight enhancement from winter burns? Different fuel mix in winter (increased wood burning with low EC/CO) may falsely enhance the deposition loss apparent in summer.
Summary • Photochemical processes leading to high O3 also lead to high PM2.5 levels and increased aerosol acidity in air masses that are transported across Georgia. • Elevated levels of primary pollutants (CO, NOx, SO2 and NH3) and favorable met conditions responsible for high PM2.5 mass concentrations during August 1999. • Possible regional impact from state wide prescribed burns of ~2 times the acreage in July 2001 causing high OC/EC and elevated background CO in August 1999. • First order NOy loss of observed ~70 % translates to k = 0.3 ±0.1 h-1, i.e. very rapid HNO3 deposition enhancing the CO/NOy intercept (CO background). • OCs at JST in Aug-99 estimated at 64-70 % depending on Rel. Ref. vs. TOT data. • As the Atlanta urban plume advects over BHC-rich terrain, it transitions to a more NOx-limited regime with greater RO2 abundance, indicated by an increasing OPE. • This transition bears potential for formation of SOA, explaining OC/EC increase; high OM/OC levels indicative of more oxygenated POC appear more region wide. • The receptor’s OC is up to 50 % secondary in summer, which is ~30% more than observed at the urban air mass origin during the same time period. • The prescribed burn ban for Metro Atlanta may contribute to the observed higher (OC/EC)p especially in winter.
Seasonal/Regional Aerosol Acidity Based on [SO4=/NO3-/NH4+] • Aerosol is closely neutralized / slightly alkaline in winter but more acidic in summer • Acidity caused by insufficient NH3, or unaccounted for organic amines (with higher OM/OC)?
From CO/NOy regressions JST vs GRF: NOyinit = 31/9 *NOy NOylost = NOyinit - NOy = NOyinit*(1-9/31) = 0.71*NOyinit Assume 1st order loss: NOyinit = NOy / exp(-kt) Assume 3.7 m/s N-ly flow throughout CBL: Then t = 4 h And k = 0.3 h-1