Download

1 / 38
430 likes | 857 Views
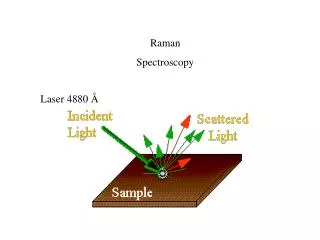
Chapter 18 Raman Spectroscopy. When radiation passes through a transparent medium, the species present scatter a fraction of the beam in all directions.

E N D
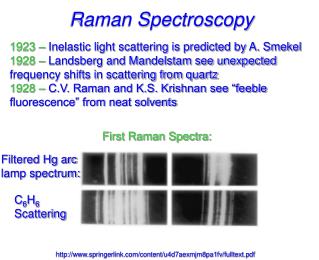
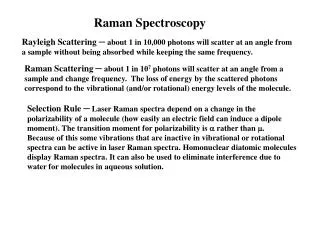
Chapter 18Raman Spectroscopy • When radiation passes through a transparent medium, the species present scatter a fraction of the beam in all directions. • In 1928, the Indian physicist C. V. Raman discovered that the visible wavelength of a small fraction of the radiation scattered by certain molecules differs from that of the incident beam and furthermore that the shifts in wavelength depend upon the chemical structure of the molecules responsible for the scattering.
Raman Spectroscopy • The theory of Raman scattering shows that the phenomenon results from the same type of quantized vibrational changes that are associated with infrared absorption. Thus, the difference in wavelength between the incident and scattered visible radiation corresponds to wavelengths in the mid-infrared region. • The Raman scattering spectrum and infrared absorption spectrum for a given species often resemble one another quite closely.
Raman Spectroscopy • An important advantage of Raman spectra over infrared lies in the fact that water does not cause interference; indeed, Raman spectra can be obtained from aqueous solutions. • In addition, glass or quartz cells can be employed, thus avoiding the inconvenience of working with sodium chloride or other atmospherically unstable window materials.
THEORY OF RAMAN SPECTROSCOPY Raman spectra are acquired by irradiating a sample with a powerful laser source of visible or near-infrared monochromatic radiation. During irradiation, the spectrum of the scattered radiation is measured at some angle (often 90 deg) with a suitable spectrometer. At the very most, the intensities of Raman lines are 0.001 % of the intensity of the source; as a consequence, their detection and measurement are somewhat more difficult than are infrared spectra.
Excitation of Raman Spectra A Raman spectrum can be obtained by irradiating a sample of carbon tetrachloride (Fig 18-2) with an intense beam of an argon ion laser having a wavelength of 488.0 nm (20492 cm-1). The emitted radiation is of three types: 1. Stokes scattering 2. Anti-stokes scattering 3. Rayleigh scattering
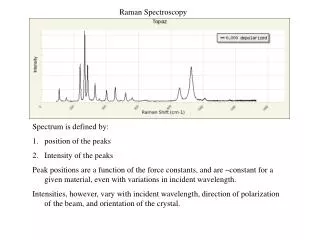
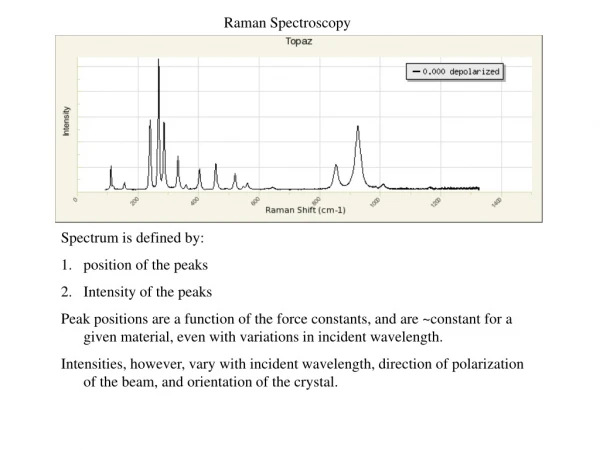
Excitation of Raman Spectra The abscissa of Raman spectrum is the wavenumber shift , which is defined as the difference in wavenumbers (cm-1) between the observed radiation and that of the source. For CCl4 three peaks are found on both sides of the Rayleigh peak and that the pattern of shifts on each side is identical (Fig. 18-2). Anti-Stokes lines are appreciably less intense that the corresponding Stokes lines. For this reason, only the Stokes part of a spectrum is generally used. The magnitude of Raman shifts are independent of the wavelength of excitation.
Mechanism of Raman and Rayleigh Scattering The heavy arrow on the far left depicts the energy change in the molecule when it interacts with a photon. The increase in energy is equal to the energy of the photon h. The second and narrower arrow shows the type of change that would occur if the molecule is in the first vibrational level of the electronic ground state.
Mechanism of Raman and Rayleigh Scattering The middle set of arrows depicts the changes that produce Rayleigh scattering. The energy changes that produce stokes and anti-Stokes emission are depicted on the right. The two differ from the Rayleigh radiation by frequencies corresponding to E, the energy of the first vibrational level of the ground state. If the bond were infrared active, the energy of its absorption would also be E. Thus, the Raman frequency shift and the infrared absorption peak frequency are identical.
Mechanism of Raman and Rayleigh Scattering The relative populations of the two upper energy states are such that Stokes emission is much favored over anti-Stokes. Rayleigh scattering has a considerably higher probability of occurring than Raman because the most probable event is the energy transfer to molecules in the ground state and reemission by the return of these molecules to the ground state. The ratio of anti-Stokes to Stokes intensities will increase with temperature because a larger fraction of the molecules will be in the first vibrationally excited state under these circumstances.
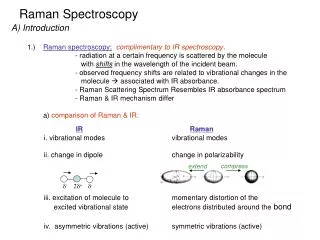
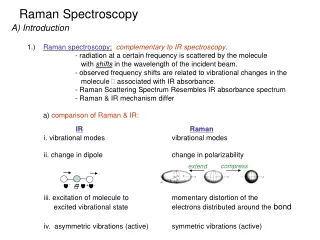
Raman vs. I.R For a given bond, the energy shifts observed in a Raman experiment should be identical to the energies of its infrared absorption bands, provided that the vibrational modes involved are active toward both infrared absorption and Raman scattering. The differences between a Raman spectrum and an infrared spectrum are not surprising. Infrared absorption requires that a vibrational mode of the molecule have a change in dipole moment or charge distribution associated with it.
Raman vs. I.R In contrast, scattering involves a momentary distortion of the electrons distributed around a bond in a molecule, followed by reemission of the radiation as the bond returns to its normal state. In its distorted form, the molecule is temporarily polarized; that is, it develops momentarily an induced dipole that disappears upon relaxation and reemission. The Raman activity of a given vibrational mode may differ markedly from its infrared activity.
Intensity of Normal Raman Peaks The intensity or power of a normal Raman peak depends in a complex way upon the polarizability of the molecule, the intensity of the source, and the concentration of the active group. The power of Raman emission increases with the fourth power of the frequency of the source; however, advantage can seldom be taken of this relationship because of the likelihood that ultraviolet irradiation will cause photodecomposition. Raman intensities are usually directly proportional to the concentration of the active species.
Raman Depolarization Ratios Polarization is a property of a beam of radiation and describes the plane in which the radiation vibrates. Raman spectra are excited by plane-polarized radiation. The scattered radiation is found to be polarized to various degrees depending upon the type of vibration responsible for the scattering.
Raman Depolarization Ratios The depolarization ratio p is defined as Experimentally, the depolarization ratio may be obtained by inserting a polarizer between the sample and the monochromator. The depolarization ratio is dependent upon the symmetry of the vibrations responsible for scattering.
Raman Depolarization Ratios Polarized band: p = < 0.76 for totally symmetric modes (A1g) Depolarized band: p = 0.76 for B1g and B2g nonsymmetrical vibrational modes Anomalously polarized band: p = > 0.76 for A2g vibrational modes
INSTRUMENTATION Instrumentation for modern Raman spectroscopy consists of three components: A laser source, a sample illumination system and a suitable spectrometer. Source The sources used in modern Raman spectrometry are nearly always lasers because their high intensity is necessary to produce Raman scattering of sufficient intensity to be measured with a reasonable signal-to-noise ratio. Because the intensity of Raman scattering varies as the fourth power of the frequency, argon and krypton ion sources that emit in the blue and green region of the spectrum have and advantage over the other sources.
Sample Illumination System Sample handling for Raman spectroscopic measurements is simpler than for infrared spectroscopy because glass can be used for windows, lenses, and other optical components instead of the more fragile and atmospherically less stable crystalline halides. In addition, the laser source is easily focused on a small sample area and the emitted radiation efficiently focused on a slit. Consequently, very small samples can be investigated. A common sample holder for nonabsorbing liquid samples is an ordinary glass melting-point capillary.
Sample Illumination System • Liquid Samples: A major advantage of sample handling in Raman spectroscopy compared with infrared arises because water is a weak Raman scatterer but a strong absorber of infrared radiation. Thus, aqueous solutions can be studied by Raman spectroscopy but not by infrared. This advantage is particularly important for biological and inorganic systems and in studies dealing with water pollution problems. • Solid Samples: Raman spectra of solid samples are often acquired by filling a small cavity with the sample after it has been ground to a fine powder. Polymers can usually be examined directly with no sample pretreatment.
Raman Spectrometers Raman spectrometers were similar in design and used the same type of components as the classical ultraviolet/visible dispersing instruments. Most employed double grating systems to minimize the spurious radiation reaching the transducer. Photomultipliers served as transducers. Now Raman spectrometers being marketed are either Fourier transform instruments equipped with cooled germanium transducers or multichannel instruments based upon charge-coupled devices.
APPLICATIONS OF RAMAN SPECTROSCOPY Raman Spectra of Inorganic Species The Raman technique is often superior to infrared for spectroscopy investigating inorganic systems because aqueous solutions can be employed. In addition, the vibrational energies of metal-ligand bonds are generally in the range of 100 to 700 cm-1, a region of the infrared that is experimentally difficult to study. These vibrations are frequently Raman active, however, and peaks with values in this range are readily observed. Raman studies are potentially useful sources of information concerning the composition, structure, and stability of coordination compounds.
Raman Spectra of Organic Species Raman spectra are similar to infrared spectra in that they have regions that are useful for functional group detection and fingerprint regions that permit the identification of specific compounds. Raman spectra yield more information about certain types of organic compounds than do their infrared counterparts. Biological Applications of Raman Spectroscopy Raman spectroscopy has been applied widely for the study of biological systems. The advantages of his technique include the small sample requirement, the minimal sensitivity toward interference by water, the spectral detail, and the conformational and environmental sensitivity.
Quantitative applications Raman spectra tend to be less cluttered with peaks than infrared spectra. As a consequence, peak overlap in mixtures is less likely, and quantitative measurements are simpler. In addition, Raman sampling devices are not subject to attack by moisture, and small amounts of water in a sample do not interfere. Despite these advantages, Raman spectroscopy has not yet been exploited widely for quantitative analysis. This lack of use has been due largely to the rather high cost of Raman spectrometers relative to that of absorption instrumentation.
Resonance Raman Spectroscopy Resonance Raman scattering refers to a phenomenon in which Raman line intensities are greatly enhanced by excitation with wavelengths that closely approach that of an electronic absorption peak of an analyte. Under this circumstance, the magnitudes of Raman peaks associated with the most symmetric vibrations are enhanced by a factor of 102 to 106. As a consequence, resonance Raman spectra have been obtained at analyte concentrations as low as 10-8 M.
Resonance Raman Spectroscopy The most important application of resonance Raman spectroscopy has been to the study of biological molecules under physiologically significant conditions; that is , in the presence of water and at low to moderate concentration levels. As an example, the technique has been used to determine the oxidation state and spin of iron atoms in hemoglobin and cytochrome-c. In these molecules, the resonance Raman bands are due solely to vibrational modes of the tetrapyrrole chromophore. None of the other bands associated with the protein is enhanced, and at the concentrations normally used these bands do not interfere as a consequence.
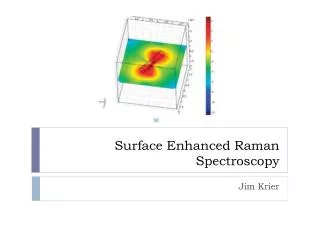
Surface-Enhanced Raman Spectroscopy (SERS) Surface enhanced Raman spectroscopy involves obtaining Raman spectra in the usual way on samples that are adsorbed on the surface of colloidal metal particles (usually silver, gold, or copper) or on roughened surfaces of pieces of these metals. For reasons that are not fully understood, the Raman lines of the adsorbed molecule are often enhanced by a factor of 103 to 106. When surface enhancement is combined with the resonance enhancement technique discussed in the previous section, the net increase in signal intensity is roughly the product of the intensity produced by each of the techniques. Consequently, detection limits in the 10-9 to 10-12 M range have been observed.