Download
1 / 11
110 likes | 220 Views
The Buoyant Plume Lift-off Zone as a Test of Coastal Sediment Transport Models. David A. Jay, Philip M. Orton and Douglas J. Wilson OGI School of Science and Engineering Oregon Health & Science University, Portland, OR Research Supported by the National Science Foundation

E N D
The Buoyant Plume Lift-off Zone as a Test of Coastal Sediment Transport Models David A. Jay, Philip M. Orton and Douglas J. WilsonOGI School of Science and EngineeringOregon Health & Science University, Portland, ORResearch Supported by the National Science Foundation Thanks to Rocky Geyer and Dan MacDonald, WHOI, Denise Reed, LSU and and Ray McQuin, Captain, R/V Barnes, UW
Concept -- • “Challenging” data sets are needed to test models. • Desirable properties -- • strong sediment transport in a simple geometry • tractable experimental site with definitive data • broad range of particle sizes • departure from local vertical equilibrium (e.g., strong advection) • aggregation and settling/erosion alter the size distribution • strong gradients in salinity, bedstress and vertical mixing • wave-current interactions (not in this data set) • variable sediment transport direction • supply limitation, variable bed properties • poorly understood, but geologically relevant! • Fraser River mouth as a valuable experimental site
Concept (Continued) -- • New types of data need new data analyses methods! • Tools: • High spatial resolution allows a variety of calculations • Joint acoustic/optical methods to encompass broad size ranges • Need better data-driven treatment of vertical turbulent mixing • Use a multi-sensor inverse method to determine WS classes • Objectives: • Analyze SPM balance by WS class (ideally), for now, by fines vs. flocs • Understand SPM transport in advection-dominated systems • Match data analyses with simple theoretical as well as numerical models
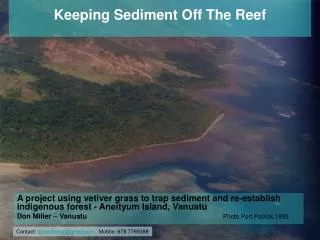
The Fraser River Setting: • Compact glaciated basin, <10 of latitude • Summer, single-event hydrograph • Flows higher in cold PDO/La Niña years -- 1999 flow was the largest since 1974 • 2000 was within the average range • Average total load is 18.5x10⁶ mt with 6.5x10⁶ mt of sand • Fraser delta is growing, unstable? • Delta is sandy, fines in Straits of Georgia • Flows monitored, 30+ yrs sediment transport data, multiple stations in river
1999-2000 Fraser River Data Sets -- • 300 and 1200 kHz ADCP, ABS (coarse material) & velocity • Towed salinity, OBS (for fines) • WS from Owen tube, size from LISST (2000 only), Coulter counter size • Bed material, pump/Niskin bottles • Bedforms from echo sounder • LMER Chl, zooplankton (1999) • 1999 -- extreme flows, few aggregates in river, short Tresidence • 2000 -- more normal year with aggregation, retention of SPM on the neaps • Anchor stations, lateral and longitudinal sections, with two vessels (1999 only) 1999 anchor calibration stations 1999 mouth drifts Drifts D&E Drifts A,B,C 25/7/1999 Drifts 2000 bed sizes
Fraser River Supplies a Broad Range of SPM Sizes, modified by Estuary/Plume: • Sand and floc have similar settling velocities WS, but distinguished by location, dis-aggregated sizes, distinct acoustic responses LISST-100 Low bedstress, salt wedge sample --Coarse fraction is flocs ABS Response Settling Tube River sand Plume Flocs
Drift Tracks at ~35 min Intervals -- A A B B C C D D E Salinity E X-velocity Along-drift velocity (left) and salinity (right) at end of ebb. Very strong shear and stratification, leading to SPM advection
Evolving Plume SPM Distributions -- • Large (acoustically visible) particles settle out due to reduced vertical mixing. Small particles dominate in pycnocline, freshwater. ABS Flocs/Sand OBS Fines
Sand&Floc 2-D Dynamic Balance -- • Strong alongchannel advection at plume lift-off • C/t, vertical diffusion, and settling smaller -- NOT a local balance in z • W important in upper water column at lift-off • Need better vertical mixing representation, which includes interfacial mixing near pycnocline • Lateral advection? Not measured here, can be evaluated in lateral sections
2-D Dynamical Balance for Fines -- • Strong advection in pycnoclne, settling not important • What balances advection if not settling? • Need to estimate loss to aggregation • Need better vertical mixing representation! • Lateral advection? No! V/U
Conclusions • SPM balance strongly advective at plume lift-off • Mixing, advection, settling, aggregation all important • Broad size distribution requires multiple sensors, inverse analysis techniques to separate WS classes • Need to evaluate turbulence field from data using mixing efficiency, salt and momentum balances (Kay and Jay, submitted to JGR) • Particle field evolves rapidly in lift-off zone -- sampling scales must be on consistent with processes • Particle settling, transformations in the lift-off zone affect delta and shelf processes • Analytical, conceptual and modeling challenges abound