Download
1 / 49
500 likes | 826 Views
Near Infrared (NIR) Spectroscopy and Calibration in Biomass Characterisation Paul Geladi. Paul Geladi. Head of Research NIRCE Unit of Biomass Technology and Chemistry Swedish University of Agricultural Sciences Umeå Technobothnia Vasa paul.geladi@btk.slu.se paul.geladi@syh.fi.

E N D
Near Infrared (NIR) Spectroscopy and Calibration in Biomass CharacterisationPaul Geladi
Paul Geladi Head of Research NIRCE Unit of Biomass Technology and Chemistry Swedish University of Agricultural Sciences Umeå Technobothnia Vasa paul.geladi@btk.slu.sepaul.geladi@syh.fi
Content • What is biomass? • What is NIR spectroscopy? • Examples • What is calibration? • Advanced topics
Content • What is biomass? • What is NIR spectroscopy? • Examples • What is calibration? • Advanced topics
Bioenergy Pulp and paper Forestry Non-food Building materials Textiles Biomass Consumer products Food & feed Feed and safety
Where is biomass found? • Biotechnology • Natural products • Bioenergy
What is special about biomass? • O-H • C-H • N-H • C=O • different atom sizes = good • IR+NIR energy = movements of bonds
O O O O H H H H H H H H
Content • What is biomass? • What is NIR spectroscopy? • Examples • What is calibration? • Advanced topics
Near Infrared Spectra (NIR) Cosmic Gamma Xray Ultraviolet Visible NIR Infrared Microwaves 780-2500nm Suitable for all organic and bio materials Robust for industrial use Good penetration depth Many modes of measuring Powerful multivariate results
Near Infrared Spectra Fast Simple sample preparation Nondestructive Online for process applications Need for calibration Opportunity for data analysis
Near Infrared Spectra? Visible Near infrared Infrared Raman 400nm 780nm 2500nm 15000nm Visible Infrared Raman Polarization
Content • What is biomass? • What is NIR spectroscopy? • Examples • What is calibration? • Advanced topics • Plans for a network of excellence • Acknowledgement
EXAMPLES 1 • Organic synthesis • Liquid • Fiberoptic transflectance • Over time
Fibersin Fibers out Mirror
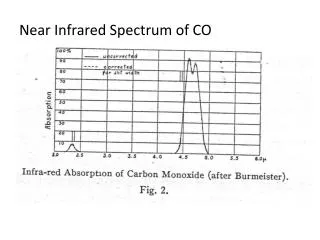
H2O ”Absorbance” visible near infrared Wavelength
Organic synthesis over time Absorbance Wavelength
CONCLUSION 1 • Possible to follow a reaction over time • Identify reagents, products, intermediates • Reaction kinetics
EXAMPLES 2 • Whole grain and flour • Solid • FT-NIR reflectance • Genetic variation
FLOUR Pseudoabsorbance Wavelength
WHOLE GRAINS Pseudoabsorbance Wavelength
CONCLUSION 2 • Grain and flour different • Genetic information • Location information • Accurate protein content
Where used? Food Feed Biofuel Fossil fuel Plastics Wood and pulp Environmental and waste Clinical and pharma In vivo
Rapid process monitoring for biofuels • Canary reed grass • Pellet / Briquette press • The role of humidity
Briquette machine Biofuel energy unit
Mixing drum with window for measurement Process NIR spectrometer
Reed canary grass Briquette
Predict = determine quality ahead Humidity for briquette quality Other parameters (e.g. ash content, energy, CO2) for energy production
Measure how? • Location (how many? where?) • How often? • How detailed? Buckets? Single particles?
Content • What is biomass? • What is NIR spectroscopy? • Examples • What is calibration? • Advanced topics
Calibration Spectral property Model Concentration
y Calibration Slope a Offset
Multivariate calibration K y X f + = b I y=Xb+f
Why calibrate? Spectrum Concentration Spectrum -measured in 1 min -no sample preparation -on-line possible -noninvasive -nondestructive Concentration -sample preparation -slow -expensive -waste chemicals -destructive
Methods of data analysis Multivariate calibration Classification Multivariate image analysis Multiway analysis Neural nets Genetic algorithms
Content • What is biomass? • What is NIR spectroscopy? • Examples • What is calibration? • Advanced topics
Instrumentation Speed, Robustness Simplified instrumentation High quality instrumentation Experimental instrumentation Complexity
Imaging / Spectroscopy An image for each wavelength A spectrum for each pixel
Table : Wavelength bands in some airborne / satellite imaging systems Band/channelWavelength (nm) SPOT-XS LANDSAT-TM JERS-OPS AVIRIS 1 500-590 450-520 520-600 224 bands 2 610-680 520-600 630-690 every 10nm 3 790-890 630-690 760-860 390-2500 nm 4 - 760-900 760-860* 5 - 1550-1750 1600-1710 6 - 10400-12500 2010-2120 7 - 2080-2350 2130-2250 8 - - 2270-2400 * bands 3 and 4 are a stereo pair. SPOT-XS= (Système Probatoire d'Observation de la Terre) Image size 60x60 km; resolution 20x20 m. (Panchromatic = B/W resolution 10x10 m). LANDSAT-TM = (Thematic Mapper) Image size 185x172 km; resolution 30x30 m JERS-OPS = Japanese Earth ResourcesSatellite - Optical Sensor 75x75km; resolution 18.3x25.4 m. There is also 1.275 GHz radar. AVIRIS = (Airborne Visible/Infrared Imaging Spectrometer ) Typical 512x614 pixels and 20x20 m resolution.
Resolution • Wavelength • reduction and selection • Time • fast product streams • parallel measurements • Space • 0-D bulk analysis • 1-D product streams • 2-D images, microscopy • 3-D tomography
What is new and exciting? • Spatial resolution imaging in 2D, 3D • Fast streams in 1D • Polarisation etc. • Simplified instrumentation • Advanced data analysis • Database / search / control / presentation
Books to read B. Osborne, T. Fearn & P. Hindle, Practical NIR Spectroscoy 2nd ed., Longman Scientific & Technical, Harlow, 1993, ISBN 0-582-09946-3 D. Burns & E. Ciurzak eds., Handbook of Near-Infrared Analysis 2nd ed., Marcel Dekker, New York, 200, ISBN 0-8247-0534-3 H. Siesler, Y. Ozaki, S. Kawata & H. Heise eds., Near-Infrared Spectroscopy, Wiley-VCH, Weinheim, 2002, ISBN 3-527-30149-6