Download
1 / 12
120 likes | 220 Views
Is sea ice saline?. Heat and mass transfer Processes - Focus on Polar Regions during Winter Processes cooling surface water during the polar winter are longwave emission, sensible heat transfer and latent heat transfer Wintertime cooling rates over the East Greenland Sea during winter:

E N D
Heat and mass transfer Processes - Focus on Polar Regions during Winter Processes cooling surface water during the polar winter are longwave emission, sensible heat transfer and latent heat transfer Wintertime cooling rates over the East Greenland Sea during winter: Q = cooling rate = 200 W m-2 = 200 J s-1 m-2
Heat and mass transfer Processes - Focus on Polar Regions during Winter Important Simplification: The cooling only effects the "mixed layer", depth = Z~100 m 1) The cooling can chill the seawater: Q = CZ (dT/dt) Or, if the seawater temperature is at the freezing point, 2) The cooling forms sea ice: Q = iLf (dZ/dt)
Heat and mass transfer Processes - Focus on Polar Regions during Winter Estimate the water cooling rate and the ice thickening rate assuming: =1028 kg/m3; C=4000 J kg-1oC-1; Z=100 m; Lf=0.33x10⁶ J kg-1; i = 500 kg/m3 and Q = 200 J s-1 m-2 Water cooling rate = (dT/dt) ~ 1 oC/month Ice thickening rate = (dZ/dt) ~ 3 meter/month
Heat and mass transfer – Focus on Polar Regions during Winter There are complications: 1) Once sea ice forms it decreases the magnitude of the Q. Calculations shown previously overestimate the ice thickening rate for wintertime conditions in the East Greenland Sea (dZ/dt ~ 1 meter/month is more reasonable) 2) Constitutional Supercooling - before we discuss this we need to talk about the chemical thermodynamics of a solution/ice system
SEA ICE FORMATION – CURRY AND WEBSTER, pp. 119-126, pp. 151-156, pp. 255-257 Chemical thermodynamics of sea ice formation – Seawater (one phase; liquid) is composed of two components (water and salt), so the Gibb’s phase rule indicates three degrees of freedom We measure pressure, salinity and temperature. It follows that the thermodynamic state of seawater is "fixed" by measurement (at least where we make measurements) Freezing occurs at the ocean surface, pressure is constant at a known value (1 bar), hence only two of three degrees of freedom are actually "free" When chilled to the freezing point an additional phase (solid ice) is formed. Now the system has only one degree of freedom. Thus prescribing, or measuring, the water temperature implies that the salinity of the water is constrained and vice versa This relationship is called the liquidus curve or liquidus function: Tfp = To – K S Where: Tfp=freezing point, To=273, K=positive constant and S is the salinity
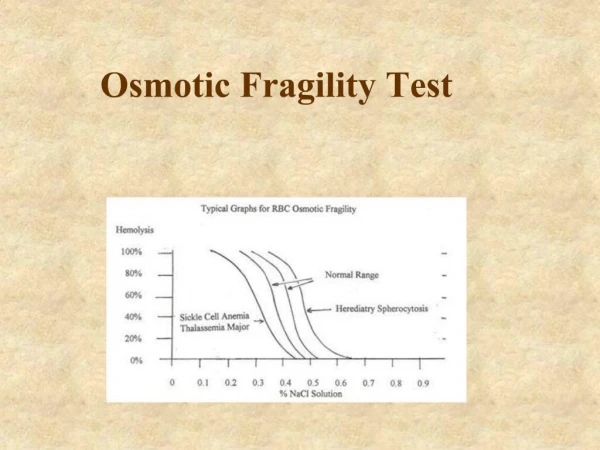
CURRY AND WEBSTER - FIGURE 4.8 -The liquidus describes the temperature/salinity relationship -For typical salinities (35 psu) the freezing point is ~ -2 oC -Imagine a mixed layer containing seawater at point “B” -Cooling results in freezing of a fraction of the water -Freezing results in a rejection of salt into the remaining liquid -The ice is purified (we will see an important caveat to this) -Salt rejected from the ice enhances the salinity of the water immediately below the ice/water interface
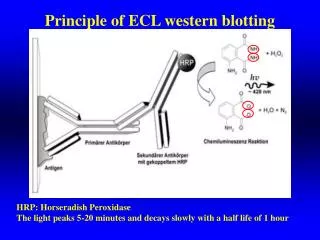
Constitutional Supercooling Environmental Temp and Freezing Point Temp Sea Ice Environmental Temp Seawater Heat Salinity Salinity Note: Ice growth rates are largest where the difference between the freezing point temperature curve and theenvironmental temp curve is largest. In this region a phenomenon called constitutional supercooling can develop
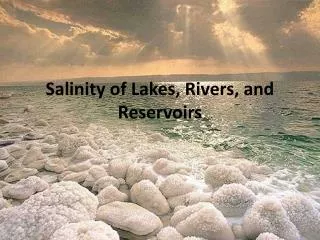
Constitutional Supercooling: At the ice/water interface, the fluxes of heat and salt are carried by molecular diffusion The heat diffusivity is one hundred times larger than the mass (salt) diffusivity The heat and salt fluxes are coupled, i.e. the heat flux "drives" ice formation and thus increases in salinity (note: salt is excluded from the growing ice) The salinity gradient must be appreciable to transport the salt, and hence, salinity values close to the interface are large while a few millimeters away the salinity values are much smaller (closer to that of the bulk seawater) It follows that the difference between the blue and red curves is a maximum close to, but not right at, the ice/water interface The ice growth rate is proportional to the horizontal distance between the blue and red curves Perturbations at a flat ice/water interface become unstable, the perturbations amplify, "ice fingers propagate" away from the interface Brine occlusions forming between the ice fingers, can seal off, contaminating the ice with salty brine (bad news if you melt sea ice for a drink)
Ice Solution Constitutional Supercooling at the ice/solution interface:
Freshly formed sea ice, when melted, has appreciable salt in it (~ 10 psu) This salinity is not trapped in the crystals but within brine channels formed during freezing Constitutional supercooling, including the processes of ice growth instabilityfingering and brine occlusion results in brine entrapment within sea ice With aging, particularly over a complete season, ice becomes less saline as brine drains from the brine pockets. I.e., the sea ice becomes less salty with age