Download
1 / 17
180 likes | 340 Views
Graphing General Rational Functions. What’s the big idea?. We’re always looking for shortcuts to make sketching easier. The next two questions shed some light on a function’s graph: What happens to f(x) as x as gets closer and closer to where the denominator is zero ?

E N D
What’s the big idea? • We’re always looking for shortcuts to make sketching easier. The next two questions shed some light on a function’s graph: • What happens to f(x)as x as gets closer and closer to where the denominator is zero? • What happens to f(x)as x goes way right (positive infinity) or way left (negative infinity)? • The answer to the first question deals with asymptotes. The answer to the second question deals with the end behavior of a function
Talkin’ bout Asymptotes. • Let’s look at f(x) = 1/(x-2) • We know that x ≠ 2. But what happens as x gets close to 2? • If x = 1.9999, f(x) = -10,000 • If x = 2.0001, f(x) = 10,000. Ah! As x approaches the asymptote from the left, the function goes to -∞ And as x approaches the asymptote from the right, the function goes to ∞ We write that as: x 2-f(x) -∞ x 2+f(x) ∞
Vertical Asymptotes • The line x = a is a vertical asymptote of f(x)if f(x) ∞ or f(x) -∞ as x approaches a from the left or right side. • NOTE: We are not guaranteed a vertical asymptote simply because we have a restricted domain value. • Example:f(x) = 3x/x • Notice how the x just cancels off? • When that happens, you get a holeinstead of a vertical asymptote. • So the equation becomes y = 3 but with a hole at x = 0 (the domain restriction)
Rational Function: f(x) = p(x)/q(x) • Let p(x) and q(x) be polynomials with no mutual factors. • p(x)= amxm + am-1xm-1 + ... + a1x+ a0 • Meaning: p(x) is a polynomial of degree m • Example:3x2+2x+5; degree = 2 • q(x) = bnxn + bn-1xn-1 + ... + b1x+ b0 • Meaning:q(x) is a polynomial of degree n • Example:7x5-3x2+2x-1; degree = 5
Key Characteristics • x-interceptsare the zeros ofp(x) (the top) • Meaning: Solve the equation: p(x) = 0 • Vertical asymptotes occur at zeros ofq(x) • Meaning: Solve the equation: q(x) = 0 (bottom) • Horizontal Asymptote depends on the degree of p(x), which is m, and the degree of q(x), which is n. • If m < n (bottom wins), then y = 0 • If m = n (tie), divide the leading coefficients • If m > n (top wins), then NO horizontal asymptote
3x2 x2-4 Graphing a rational function where m = n • Graph y = • x-intercepts: Set top = 0 and solve! • 3x2 = 0 x2 = 0 x = 0. • Vertical asymptotes: Set bottom = 0 and solve • x2 - 4 = 0 (x - 2)(x+2) = 0 x= ±2 • Degree of p(x) = degree of q(x) top and bottom tie divide the leading coefficients • Y = 3/1 = 3. • Horizontal Asymptote:y = 3
x y -4 4 -3 5.4 -1 -1 0 0 1 -1 3 5.4 4 4 Here’s the picture! You’ll notice the three branches. This often happens with overlapping horizontal and vertical asymptotes. The key is to test points in each region! Domain: x ≠ ±2 Range: y > 3 & y ≤ 0
4 x2 + 1 Graphing a Rational Function where m < n • Example: Graph y = • State the domain and range. • x-intercepts: None; p(x) = 4 and 4 ≠ 0 • Vertical Asymptotes: None; q(x) = x2 + 1. • But if x2 + 1 = 0 x2 = -1. No real solutions. • Degree p(x) < Degree q(x) --> Horizontal Asymptote at y = 0 (x-axis)
Let’s look at the picture! • We can see that the domain is ALL REALS while the range is 0 < y ≤ 4
x2- 2x - 3 x + 4 Graphing a Rational Function where m > n • Graph y = • x-intercepts: x2- 2x - 3= 0 • (x - 3)(x + 1) = 0 x = 3, x = -1 • Vertical asymptotes: x + 4 = 0 x = -4 • Degree of p(x) > degree of q(x) • No horizontal asymptote
x y -12 -20.6 -9 -19.2 -6 -22.5 -2 2.5 0 -0.75 2 -0.5 6 2.1 Picture time! • Not a lot of pretty points on this one. • This graph actually has a special type of asymptote called “slant.” It’s drawn in purple. Don’t worry, I’ll show you how it works.
Slant Asymptotes Equation of Asymptote! • These happen when the top polynomial overpowers the bottom polynomial. • “Overpowers” means has a higher degree. • The equation of the slant asymptote is just the result when you divide the two polymomials out. • Prior example: Remainder is Irrelevant
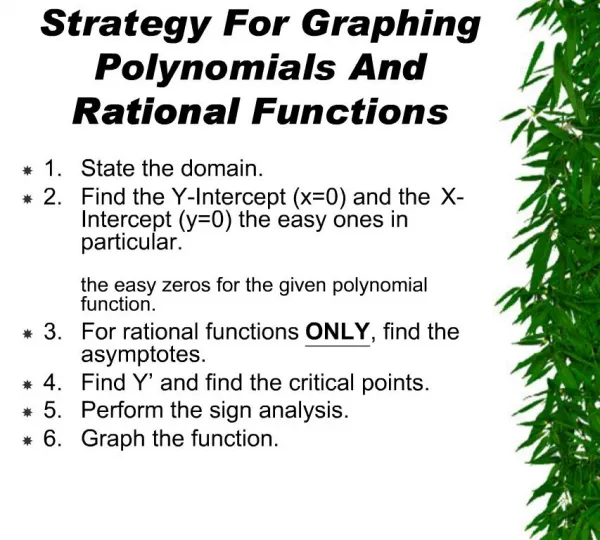
The Big Ideas • Always be able to find: • x-intercepts (where numerator = 0) • Vertical asymptotes (where denominator = 0) • Horizontal asymptotes: • If bottom wins: x-axis asymptote • If they tie: divide leading coeff. • If top wins: No horizontal asymp. • Sketch branch in each region (plot points)
Practice Problems 6 x2 + 3 • Graph y = No x-intercepts No vertical asymptote H.A.: y = 0
Practice Problems x-int: x2 – 4 = 0; x = ±2 V.A.: x + 1 = 0 x = -1 H.A.: Top wins: No H.A. Slant: y = x - 1 x2 - 4 Graph y = x + 1
Practice Problems x-int: 2x2 = 0 x = 0 V.A.: x2 – 1 = 0 x = ±1 H.A.: Tie y = 2/1 = 2 Graph y = 2x2 x2 - 1 Bounce back, baby!