Download
1 / 27
270 likes | 454 Views
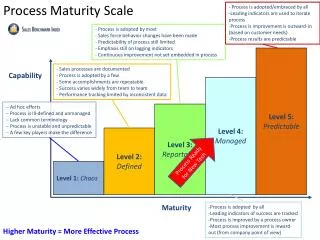
MEASURING PROCESS QUALITY ON AN ORDINAL SCALE BASIS. E. Bashkansky, T.Gadrich Industrial Engineering & Management Department E.Godik Software Engineering Department. PROCESS QUALITY. Process Quality Control. Measure. Target. Gap Action. Ordinal Variables in Quality Engineering.

E N D
MEASURING PROCESS QUALITYON AN ORDINAL SCALE BASIS E. Bashkansky, T.GadrichIndustrial Engineering & Management DepartmentE.GodikSoftware Engineering Department
PROCESS QUALITY Process Quality Control Measure Target Gap Action
Ordinal Variables in Quality Engineering • Quality sort • Customer satisfaction grade • Vendor’s priority • Customer importance (QFD) • Failure severity • Internet page rank • Vote result (pro, abstain, contra) • the power of linkage (QFD) • … Traditional approach: assigning arbitrary numerical values to the different categories of the ordinal variable
Traditional Approach • Quality variable having three levels of quality “H” – High Quality “M” – Medium Quality “L” – Low Quality H > M > L Scale A Scale B
Traditional Approach - Average • Sample HLL • According to A latent scale the average equals 1.67 positioning the average between Low and Medium quality • According to B latent scale the average equals 3.67positioning the average between Medium and High quailty
Study’s Purpose Estimationthe quality of a stable processwithout assigning any numerical values to the ordinal variables.
Median HHHHHHMMMLLLL Advantage: Simple Natural Measure for the Ordered Samples Disadvantage: Robust HHHMLLL MMMMLLL
Quality measure of a given sample Equals to the relative position of the given sample in a qualityladder that is built for a samples of the same size.
The Rational of a Quality Ladder Q -------- HH…H -------- -------- -------- quality represented by a sample -------- -------- -------- -------- -------- -------- LL…L
Various possible quality ladders for a sample n=2 HH HM MM HL ML LL HH HM HL MM ML LL HH HM HL=MM ML LL
F-function(Cumulative distribution function – CDF) Define: Pi = proportion of products belonging to i - th quality level. FL =PL ; FM =PL + PM ; FH = PL + PM + PH =1
Graphical presentation of a different sample using F-space R={LLLLL} S={HHHHH} T={MMMMM} O={HHMLL} P={HMMLL{ Q={HMMML}
Proposed Quality Ladders • Rank and dispersion (R&D)- based on Franceschini F. , Galetto M., Varetto M., Qual. Reliab. Engng. Int. 2005; 21:177–195 • Median and Entourage (M&E) • Proportion Ratio and Dispersion (PR&D)
1.Rank and dispersion criterion (R&D criterion) The algorithm has two stages: First stage sorts the samples in ascending order according to their ranks value . Rank value = 0*(# L) + 1*(# M) + 2*(# H) Second stage orders samples belonging to the same rank class according to their dispersion values in descendingorder. The ordered sample having larger dispersion is located at a lower position in the quality ladder. Disadvantage
FM S 1 T 0.5 O 450 R 0 0.5 1 FL Figure 4: Graphical illustration of rank and dispersion criterion Graphical interpretation of R&D criterion
2.Median and Entourage Criterion (M&E criterion)-Example Quality
3.Proportion Ratio and Dispersion criterion (PR&D) - first stage Define the proportion ratio (PR) as: As the quality of the sample increases, the value of PR decreases, and vice versa. So, first, samples are arranged according to their decreasing PR values.
FM S 1 T Q Z R FL 0 1 Figure 6: Graphical illustration for Proportion ratio criterion Graphical illustration of PR criterion
Verification of proposed criterionssample (n=100) vs. infinite population
Verification of proposed criterionssample (n=100) vs. infinite population
Verification of proposed criterions relative position of the sample(n=100)modequalityvs. relative quality position in the infinite population
Verification of proposed criterionsrelative position of the sample( n=10 )modequalityvs. relative quality position in the finite ( N=100 ) population
Verification of proposed measures:relative position of the sample( n=10 )medianqualityvs. relative quality position in the finite ( N=100 ) population