Download
1 / 81
820 likes | 981 Views
Data Analysis within an RtI 2 Framework: Linking Assessment to Intervention . Aimee R. Holt, PhD Middle Tennessee State University. What is RTI 2 ?. A systematic and data-based method for addressing academic concerns: identifying defining & r esolving

E N D
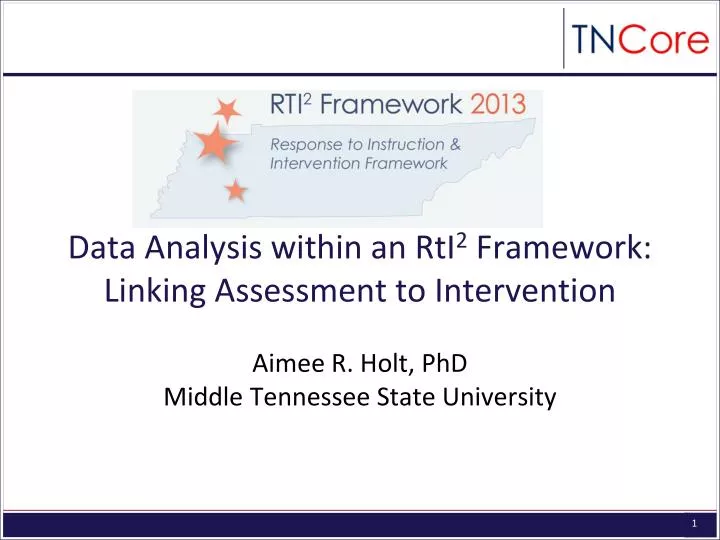
Data Analysis within an RtI2 Framework: Linking Assessment to Intervention Aimee R. Holt, PhD Middle Tennessee State University
What is RTI2? • A systematic and data-based method for addressing academic concerns: • identifying • defining & • resolving Brown-Chidsey & Steege (2010)
RTI2 is a general education initiative…. • Components of RTI2 • High-quality instruction • Frequent assessment of academic skills • Data-baseddecision making Brown-Chidsey & Steege (2010)
Define the Problem • Develop an Assessment Plan • Analyze the Assessment Plan Results • Develop an Intervention Plan • Analyze the Results of Implementation • Determine Next Steps Implement Plan Progress Monitor Problem Solving • At each tier within RTI2, a problem solving model is employed to make decisions Problem Identification Plan Evaluation Problem Analysis
Universal Screeners • LEAs are required to: • Administer a nationally normed, • skills-baseduniversal screener • to students at their grade level
For K-8, Universal Screeners shouldbe administered 3X per year • In grades 9-12, there are multiple sources of data that can be reviewed, such as: • EXPLORE, PLAN and ACT; Tennessee Comprehensive Assessment Program (TCAP) which includes Writing (TCAP-WA), End of Course (EOC), 3-8 Achievement and in 2014-2015, Partnership for Assessment of Readiness for College and Careers (PARCC); TVAAS
Characteristics of Appropriate Universal Screening Tools • Helps answer questions about efficiency of core program • Aligns with curriculum for each grade level • Skills mastery aligns with state mandated year-end assessment Ikeda, Neessen, & Witt (2008).
3 Types of CBM’s • General Outcome Measures (GOM’s) • Skill Based Measures • Sub-skill Mastery Measures
General Outcome Measures • GOMs • sample performance • across several goals at the same time • capstone tasks • Ex. Oral reading fluency • Can be used for • screening(benchmarking), • survey & specific level assessment • progress monitoring
Skills-Based Measures • SBM are similar to GOM’s but can be used when capstone tasks are not available • Ex. Math computation • Can be used for • screening(benchmarking), • survey & specific level assessment • progress monitoring
Subskill Mastery Measures • SMMs are very narrowin focus • Ex. Names of letters • Should not be used for benchmarking • (exception… early skills such as Letter Naming Fluency, Letter Sound Fluency, Number Naming Fluency)
Example Reading Skills Typically Assessed by Universal Screeners
Making Decisions about Group Data • Review universal screening data to answer the following questions: • Is there a class wide problem? • Who needs a Tier II intervention? • Be sure to examine students at the margin • Does anyone need Tier III now?
Who needs a Tier II or Enrichment? • Winter Benchmark for ORF: • 90th %- 153; • 25th% - 72; • Winter Benchmark for Maze: • 90th % - 25; • 25th% - 9; • Instructional level criteria • For contextual reading – 93-97% correct • For most other academic skills – 85-90% correct 26 /98% 154/100% 154/85% 26 /79% 68/ 95% 09/94% 08 /80% 68/88%
Examining students at the Margins • Winter Benchmark for ORF: • 90th %- 153; • 25th % - 72; • Winter Benchmark for Maze: • 90th % - 25; • 25th % - 9; • Instructional level criteria • For contextual reading – 93-97% correct 75/96% 11 /100% 10/97% 80/100% 73/82% 11/75%
Identifying who needs Tier III • Winter Benchmark for ORF: • 25th% - 72; • 10th % -44 • Winter Benchmark for Maze: • 25th % - 9; • 10th % - 6 • Instructional level criteria • For contextual reading – 93-97% correct 46 / 76% 6 / 80% 42 / 83% 5 / 75%
Linking Assessment to Interventions…. • Research has shown that effective interventions have certain features in common: • Correctly targeted to the student’s deficit • Appropriate level of challenge (instructional range) • Explicit instruction in the skill • Frequent opportunities to practice (respond) • Provide immediate corrective feedback (e.g., Brown-Chidsey & Steege, 2010; Burns, Riley-Tillman, & VanDerHeyden, 2013; Burns, VanDerHeyden, & Boice, 2008;)
Academic Instruction in Reading • Both NCLB and IDEA require that instruction in the general education setting cover all 5 areas of reading identified by the National Reading Panel
Phonological Awareness • A metacognitive understanding that words we hear have internal structures based on sound • Research on PA has shown that it exerts an independent causal influence on word-level reading. (Berninger& Wagner, 2008) • Phoneme– smallest unit of speech • The English language has 44-46 phonemes
Phonics • Alphabetic principle - Linking phonological (sound) and orthographic (symbol) features of language (Joseph, 2006) • Important for learning how to read and spell • National Reading Panel –students with explicit AP instruction showed benefits through the 6th grade • Phonological awareness is a prerequisite skill
Word Reading Skills - (McCormick, 2003) • Word identification: the instance when a reader accesses one or more strategies to aid in reading words (e.g., applying phonic rules or using analogies) • Decoding – blending sounds in words or using letters in words to cue the sounds of others in a word (Joseph, 2006) • Word recognition: the instant recall of words or reading words by sight; automaticity
Fluency • “ The ability to read a text quickly, accurately, and with proper expression” (NRP, 2000 p.3-5) • Most definitions of fluency include an emphasis on prosody – the ability to read with correct expression, intonation and phrasing (Fletcher et al., 2007) • National Reading Panel -Good reading fluency skills improved recognition of novel words, expression during reading, accuracy and comprehension
Vocabulary & Text Comprehension Skills • Vocabulary knowledge – including understanding multiple meanings of words; figurative language etc.. • Identifying stated details • Sequencing events • Recognizing cause and effect relationships • Differentiating facts from opinions • Recognizing main ideas – getting the gist of the passage • Making inferences • Drawing conclusions
So you have identified your “at risk students”- now what? • You will need to conduct Survey Level Assessment (SLA) for these students • Survey Level Assessment (SLA) • Can be used to: (a) provide information on the difference between prior knowledge and skills deficits to be used to plan instructional interventions & (b)serve as baseline for progress monitoring
Why is it important to conduct Survey Level Assessments before beginning Tier II interventions? • The primary question being addressed by the survey level assessment at Tier II is • “What is the CATEGORY of the problem” • (What is the specific area of academic deficit?) (e.g., Riley-Tillman, Burns, Gibbons, 2013)
An Example of Survey Level Assessment Using DIBELS 1) Start at student’s grade level 2)Test backwards by grade until the student has reached the “low risk” benchmark for a given skill •Low risk/ established indicates the student has “mastered” that skill
For example….. In reading • comprehension & fluency = • comprehension intervention • comprehension + low fluency, but decoding = • fluency intervention • comprehension + fluency + decoding, but phonemic awareness skills • decoding intervention Riley-Tillman et al., (2013)
Let’s look at Michael a 2nd grade student • At the fall benchmark, he was identified on ORF as being in the some risk range. • His score was 30 wcpm • Survey level assessment were conducted using: • DORF 1st grade – (fluency) • DNWF 1st grade – (decoding) • DPSF 1st grade – (phonemic awareness) Problem Identification Problem Analysis
Michael’s Scores DIBELS Scores Representing Skills Mastery • DORF – 35 wcpm • DNWF – 28 scpm • DPSF – 38 pcpm
What next…. • You link your assessment data to an intervention that targets the category of skill deficit that was identified • You select progress monitoring probe(s) that assess that skill • You set the student’s goal for improvement • You can use ROI & Gap Analysis Worksheets to help with this
What progress monitoring is not… • It is NOT an instructional methodor intervention • Think of progress monitoring as a templatethat can be laid over goals and objectives from an assortment of content areas
Does a student require Tier III intervention? • Step 1: Need to check to see if the data can be interpreted • A minimum of 8-10 data points, if progress monitoring every other week, OR10-15 data points, if progress monitoring weekly to make a data-based decision to change to Tier III.
Step 2: Examine Rate of Improvement • You can compare the student’s actual ROI to the goalthat was established • You can use the ROI worksheets • Let’s complete one for Michael
Completing the ROI Worksheet for Michael 50 24 0.72 36
13 0.69 37 28
1.44 0.72 0.72 1.08
You also can visually analyze the graphed progress monitoring data • Calculate the trend line of the intervention data points and compare it to the aim (goal) line. • If the slope of the trend line is lessthan the slope of the aim line, the student may need to be moved to Tier III. • Especially if it appears that given the student’s current ROI that they will not meet year end grade level standards
Dual Discrepancy • -A student should be deficient in level and have a poor response to evidenced-based interventions (slope) to the degree that he/she is unlikely to meet benchmarks in a reasonable amount of time without intensive instruction to move: • between Tier II to Tier III as well as between Tier III and referral for a comprehensive special education evaluation. • (e.g., Brown-Chidsey& Steege, 2008; Lichenstien, 2008)