Download
1 / 15
150 likes | 222 Views
The Challenges of working with Numerous types of Data in. By Lora Egley. Source: ESRI. Project Goal. To experiment with and bring oceanographic data into Arc View. http://dusk.geo.orst.edu/book/index.html. Spatial Base. To find that “perfect” spatial representation is a challenge.

E N D
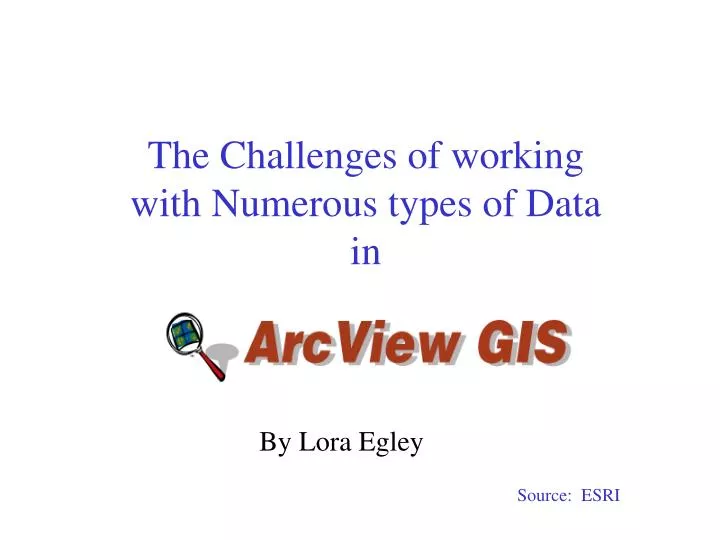
The Challenges of working with Numerous types of Data in By Lora Egley Source: ESRI
Project Goal • To experiment with and bring oceanographic data into Arc View http://dusk.geo.orst.edu/book/index.html
Spatial Base • To find that “perfect” spatial representation is a challenge. • Enormous amount of data can be extracted freely off the net. • The easy route, pay the money, to get what you need! Saves time and you can dedicate time to the heart of the real work.
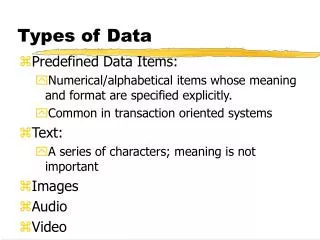
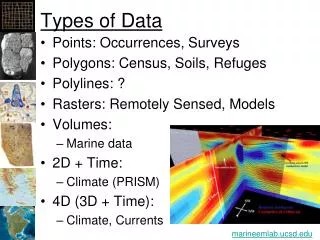
Types of spatial data • Vector • Arc View numerous formats: ex: Arcview shapefiles and VPF • Raster • Arc View supports numerous formats: ex: JPEG, BSQ’s
Chosen Data to input • ESRI Shapefiles • Vmaps from NIMA inVPF • ASCII data from CEAREX experiment
Once you have chosen a selected region to download. ESRI will list the layers that you have selected. Along with an option of which type of data compression is desired. Example of a Shapefile: Layer Description Shapefile Name 30 Degree Grid (MD) mdworld3 Administrative Units AWS)awsadmin Countries (AWS)awscntry Administrative Boundaries AWS)awswrlda River Polys (AW)awriv3mp Cities (AWS)awscitie MD=ArcView Maps and Data AA=ArcAtlas AW=ArcWorld AWS=ArcWorld ESRI DATA Source: ESRI
Vector Product Format • VMAPs • Geospatial Engine http://geoengine.nima.mil
Example of a commercial marine GIS product http://wwwzoo.im.gda.pl/bathym/basezra.html
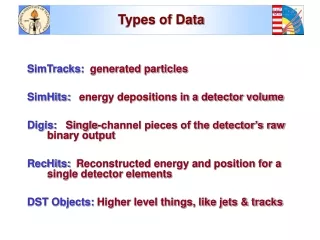
Coordinated Eastern Arctic Experiment • Sample of the ASCII bathymetry data
Bathymetry Data • Steps: From the ASCII data Set • Imported into an excel file and saved as a .txt or .csv • Important step is to ensure each column has a header, Arc View needs the headers! • Make a table, and select the features. • To make a theme: Grid the data first which then enables you to produce an overlay contour.
Obstacles • Cost • Unfamiliarity with the numerous formats • Spatial Representation
Lessons Learned • “Project files are dynamic, the steps that lead to the views of your data are stored rather than the data itself. As a result, the project stays current with your data.” Source: Hutchinson and Daniel
References • http://www.marinegis.com/dataen.html • http://wwwzoo.im.gda.pl/bathym/basezra.html • http://www.nima.mil/ • http://www.esri.com • Hutchinson S. and Daniel, L., Inside Arc View GIS., 2000. • Wright, D. and Bartlett D., Marine and Coastal Geographical Information Systems • http://dusk.geo.orst.edu/book/index.html