Download
1 / 34
340 likes | 493 Views
Regional distribution of ethnicities. Chapter 7: Ethnicity: Where are ethnicities distributed?. Ethnicity in the U.S. Latinos: 14% of the U.S. population African Americans: 12% of the U.S. population Asian American: 4% American Indian: 1%. Regional Concentrations.

E N D
Regional distribution of ethnicities Chapter 7: Ethnicity: Where are ethnicities distributed?
Ethnicity in the U.S. • Latinos: 14% of the U.S. population • African Americans: 12% of the U.S. population • Asian American: 4% • American Indian: 1%
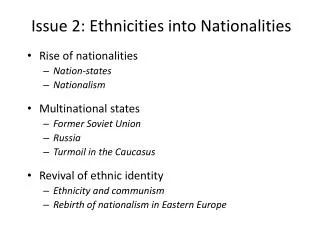
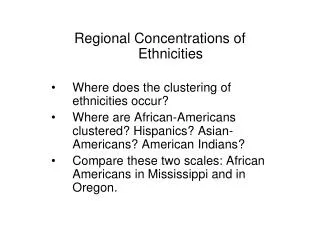
Regional Concentrations • African Americans are clustered in the Southeast. • Hispanics in the Southwest. • Asian Americans in the West. • American Indians in the Southwest and Plains.
African Americans 25% or Greater are African American Less than 1% are African American • Alabama • Georgia • Louisiana • Maryland • South Carolina • Mississippi • Maine • New Hampshire • Vermont • Idaho • Montana • North Dakota • South Dakota • Utah • Wyoming
Hispanic v. Latino/Latina • A 1995 census study showed: • 58% of Americans of Latin descent prefer the term Hispanic • 12% prefer the term Latino/Latina • 64% come from Mexico • 10% from Puerto Rico • 4% from Cuba • Clustered from the following states: • California: 30% • Texas: 20% • Florida: 15% • New York: 15%
Asian American • 4% of U.S. population. • 23% Chinese • 19% Indian • 18% Filipino • 10% Korean • 10% Vietnamese • 7% Japanese • 13% others • Largest concentration of Asian Americans is in Hawaii, followed by California.
American Indians • Within the lower 48 (continental U.S.) American Indians are most populous in the Southwest and Plains states.
Distribution within cities Where are ethnicities distributed?
African Americans • African Americans are highly clustered within cities. • ¼ of all Americans live in cities, while over ½ of African Americans are city dwellers. • At the state level it becomes even more concentrated. • Michigan is 7% African American while Detroit is 85% A.A.
Hispanic Population Distribution In states with the largest distribution (CA and TX) many urban areas are more than ½ Hispanic.
Clustering • About 90% of Hispanic and African American ethnicities live in metro areas compared with 75% of the rest of the population. • Discussion Question: • What effect does this have on desegregation? • How has this concentration affected education and the school systems, specifically the Brown v. Board of Education decision?
Historical Impact of Ethnic Clusters in Metro Areas • This clustering has been happening in cities since the early part of the 20th century. • Cities like Chicago, Cleveland, Detroit, etc attracted immigrants from Southern and Eastern Europe to factory jobs. • This led to the expansion of ethnic neighborhoods: Greektown, Little Italy, Poletown. • Most of these immigrants moved out of the cities after a generation or so. Their ethnic identity is rooted more in religion, food, etc and not location. • These neighborhoods were then filled with ethnicities that are most commonly found in urban areas today.
Migration Patterns African Americans
Distribution • Distribution of ethnicities is explained in the same way as other cultural factors: migrations. • These factors shape the distribution of African Americans in the U.S.: • Forced migration from Africa to U.S. • South to North after the Civil War • Movement from ghettos to urban neighborhoods after the civil rights movement to the present.
Forced Migration: Slave Trade • Between 1710 and 1810 an estimated 10 million slaves were shipped to the western hemisphere. • This included but was not limited to the U.S. • Most British slaves went to the Caribbean and Portuguese went to Brazil. • Many Africans living on the west coast would use their tools and weapons to capture people living further inland and sell them to the Europeans. • At the height of the slave trade Europeans used the triangular slave trade.
Slave Ships • Approximately ¼ of salves died on the trip due to the terrible conditions. • Most were packed in so tightly that the number of dead wasn’t known until they reached their destination. • They were kept in chains and barely fed. • Stronger and younger villagers were often seized first due to their high value.
Movement North • After the Civil War and the end of slavery many African Americans moved North. • East: Baltimore, Philadelphia, New York and Boston. • Central: Detroit, Cleveland • West: St. Louis, Chicago • Southwest: California, Los Angles
North American Ghetto Movement • African Americans who moved to cities ended up in the same neighborhoods as blacks who were already there. • These neighborhoods became known as ghettos after the term for Jewish neighborhoods in the Middle Ages.
Ethnicity & Race • Ethnicities display different cultural traditions that originate at particular hearths. • Asian is a race recognized by the census, Asian American is an ethnicity. • African American and black are different groups. Not all blacks are of African descent. • African American infers a cultural background while black simply refers to skin color. • Hispanic is not considered a race according to the U.S. census.
Race • Traits that characterize race are genetic. • Lactose Intolerance Affects: • 95% of Asian Americans • 65% of African Americans • 65% of Native Americans • 50% of Hispanics • 15% of European Americans • Most Europeans have a genetic mutation that continues to produce lactase, enabling them to digest lactose for their whole lives.
Usefulness of “Race” as a term • At best: biological features very so widely as to be almost unscientific • At worst: it is a basis for racism and the belief that one race has superior biological characteristics.
Separate But Equal in the U.S. • Plessyv. Ferguson • Brown v. Board of Education • Jim Crow laws
South Africa: Apartheid While the U.S. was ending segregation laws South Africa was creating laws. The legal system in S.A. was called apartheid or physical separation of geographic areas.
Classfications • Under aparthied a newborn was 1 of 4 races. • Black • White • Colored (mixed white and black) • Asian • Under these classifications it was determined where you could live, work, go to school, etc. • This system was created by the settlers from Holland who settled in Cape Town in 1652. These people became known as Afrikaans, the name of their language.
Afrikaans Resistance • While colonies lost power in African in the 20th century the Afrikaans vowed not to turn the government of South Africa over to the blacks. • Apartheid laws were to created to force blacks out of powerful positions and allow whites to thrive economically and politically. • This government created “homelands” for blacks where they were expected to move and live, removing the black population from the rest of society.
Changes • Despite the multiple revolutionaries in South Africa, including Nelson Mandela, apartheid wasn’t repealed until 1991. • Mandela, who was jailed for 27 years for being a member of the African National Congress and advocating black takeover of the government, was elected President of South Africa in 1994. • While apartheid is over, the effects of the segregation have been longer lasting: • Economic disparity • Avg. income is about 10 times lower than white S.A.