Download
1 / 16
160 likes | 287 Views
Lessons learned and future directions of OECD work on agri-environmental indicators Kevin Parris, Agricultural Policies and Environment Division, OECD, Paris, France.

E N D
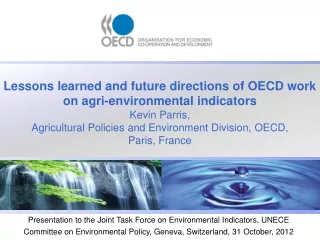
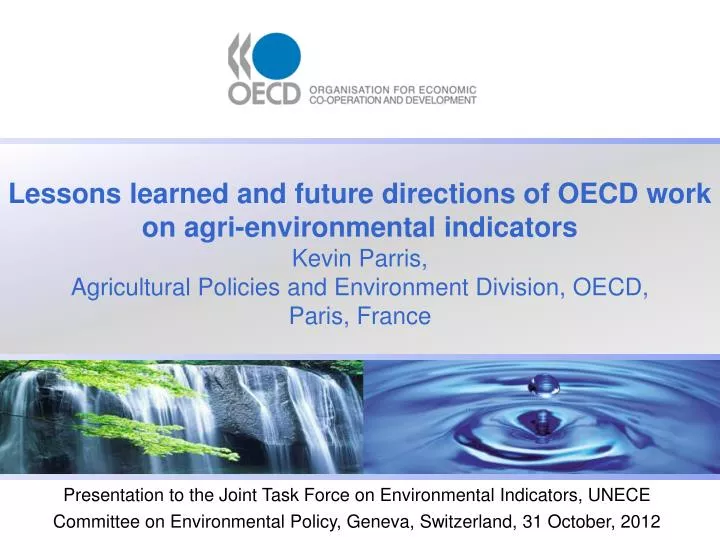
Lessons learned and future directions of OECD workon agri-environmental indicatorsKevin Parris, Agricultural Policies and Environment Division, OECD, Paris, France Presentation to the Joint Task Force on Environmental Indicators, UNECE Committee on Environmental Policy, Geneva, Switzerland, 31 October, 2012
OECD AND ITS GLOBAL PARTNERS Membership has expanded over OECD’s 50 year history to embrace 34 countries and the European Union: • Australia • Austria • Belgium • Canada • Chile • Czech Republic • Denmark • Estonia • Finland • France • Germany • Greece • Hungary • Iceland • Ireland • Israel • Italy • Japan • Korea • Luxembourg • Mexico • Netherlands • New Zealand • Norway • Poland • Slovenia • Portugal • Slovak Republic • Spain • Sweden • Switzerland • Turkey • United Kingdom • United States OECD is currently in accession talks with: Russia and enhanced engagement with: Brazil, China, India, Indonesia, South Africa
OECD Work on Agri-environmental Indicators (AEIs): Past and Present • 1993 – 2001 Environmental Indicators for Agriculture: Volumes 1, 2, and 3 • 2001 – 2011 • 7 Expert Meetings: Biodiversity, Landscapes, Soil Organic Carbon, Soil Erosion/Biodiversity, Land Conservation, Farm Management, and Water Use and Water Quality • Washington, D.C., United States, Workshop (2007) • Environmental Performance of Agriculture in OECD Countries since 1990, summary At A Glance and Electronic Database (2008) • Leysin, Switzerland Workshop (March,2010) • Zaragoza, Spain, Workshop on Water Information Systems (May 2010) • Working with OECD countries (e.g. Canada, Israel, Korea, Poland) 3
Coverage of OECD agri-environmental indicators • Policy and market drivers impacting on env. performance of agriculture • Agricultural production, land use, organic farming and transgenic crops • Nutrients: nitrogen and phosphorus balances • Pesticides sales • Energy: on-farm energy consumption, biofuel production (agric. feedstocks) • Soil – water and wind erosion • Water resources: withdrawals, irrigated area and water application rates • Water quality: nitrates, phosphorus and pesticides • Ammonia emissions: acidification and eutrophication • Greenhouse gas emissions: climate change • Methyl bromide use: ozone depletion • Biodiversity: farmland bird populations and agricultural land cover
Describes driving forces, current state and trends of environmental conditions in agriculture Highlights where ‘hot spots’ are emerging Provides a tool to better explain the causes and effects of changes in environment Compares trends in performance across countries and in relation to environment targets Establishes a database for policy analysis: monitoring, evaluation and projection scenarios Value of set of agri-environmental indicators
Definitions and methodologies for calculating indicators Data availability, quality, comparability, and spatial aggregation Trends and ranges relative to absolute levels Agriculture’s contribution to env. impacts Indicator baselines, threshold levels and targets Time lags, often environmental outcomes can take a long time to appear (phosphorus -- groundwater) AEIs in physical units, but if measured in monetary terms would be a common unit AEI limitations and areas to be developed
Work on establishing AEIs is relatively recent compared to other economic and social indicators Complexity of trying to encapsulate very diverse biophysical and economic conditions Many of the caveats and limitations to the AEIs apply to other socio-economic indicators (e.g. inflation rate, unemployment), but the biophysical element is key difference Indicators are only part of policy analyst toolbox, not whole story Viewing AEIs in a broader context
Future Directions for OECD work on AEIs • Clear mandate from OECD Agriculture Ministerial meeting (Feb 2010) to focus more on agriculture and environment • Preparing 2nd edition of OECD Compendium of Agri-environmental indicators (forthcoming early 2013) • Greater use of AEIs in OECD policy analysis: climate change; water; agriculture and environment Outlooks; and country economic surveys and env. performance reviews • Fostering closer cooperation with Member countries, new (Chile, Estonia, Israel, Slovenia) and old (Canada, Korea) • Strengthening cooperation with International Organisations, (Eurostat, FAO, UNECE); agro-food chain; research community 9
Key OECD wide AEI messages and challenges • AEIs are primarily to reveal the environmental performance of agriculture and provide one tool for policy monitoring, evaluation and outlook scenarios • Balance needed between simplicity and timeliness (policy advisors, public) and robustness (scientific soundness) • Challenge of budget constraints for new data collection and evaluation initiatives • National indicators mask pressure points spatially, but also consider issue of leading economic indicators • Thinking beyond pressure, state or response framework toward green growth indicators 10
Gross nitrogen balance • UNECE: The balance between all nitrogen added to an agricultural system and nitrogen removed from the system (kg/year/hectare) • Phosphorus balance ?
Main elements in the gross nutrient (nitrogen and phosphorus) balance calculation
Water use intensity by agriculture UNECE indicator presented as: (i) Total irrigable area. (ii) Irrigable area by type of crops grown with the aid of full or supplementary irrigation. (?) (iii) Share of irrigable area in the total utilized agricultural area.
Cropping and livestock patterns UNECE presented as: (i) Total area of the major agricultural land uses (arable, permanent grassland and permanent crops). (ii) Trends in the share of major agricultural land uses in total utilized agricultural area. (iii) Livestock numbers of major livestock types (cattle, pigs, sheep, goats and poultry). (iv) Trends in the share of the major livestock types. Indicators iii + iv in nutrient balance, but necessary on their own?
Visit the OECD website: Agri-environmental indicators: www.oecd.org/tad/env/indicators Contact: Kevin.Parris@oecd.org