Download
1 / 25
250 likes | 380 Views
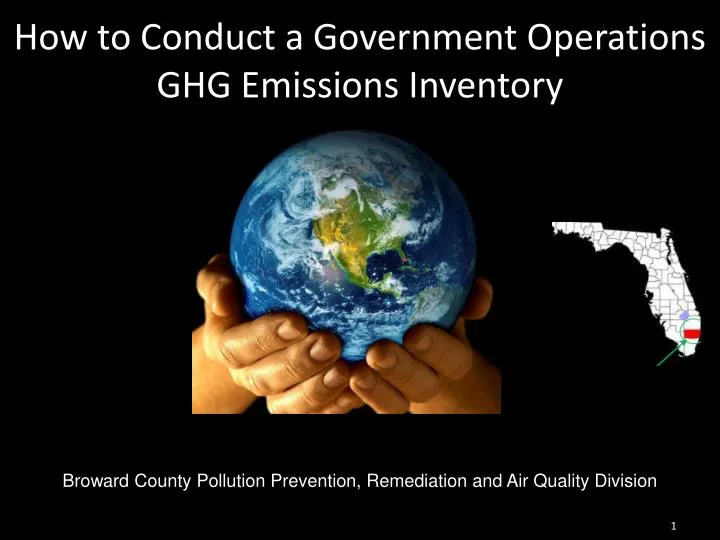
How to Conduct a Government Operations GHG Emissions Inventory. A A A A A A A A A A A A A A A A A A. Broward County Pollution Prevention, Remediation and Air Quality Division. Methodology. GHG Inventory Software and Limitations Source Categories Data sources Baseline Year

E N D
How to Conduct a Government OperationsGHG Emissions Inventory A A A A A A A A A A A A A A A A A A Broward County Pollution Prevention, Remediation and Air Quality Division
Methodology • GHG Inventory Software and Limitations • Source Categories • Data sources • Baseline Year • Analysis & Findings • Projections • Existing Measures
Inventory Basics • Report on a fiscal year basis • Base year should be reliable, reflective, and complete. Consider: • National and regional consistency • “Fiscal Year” • Completeness • Always take complete notes!!! • Identify things within your own operational control- Wholly owning an operation, facility or source, or having the ability to make changes in the facilities you lease.
Organizing the EmissionsInventory Process Government Leadership – Broward County Workgroup Lead data coordinator for each Sector Let the departments know data request is coming Collaborative process for data collection Make clear and specific data requests Use data collection forms – BC uses a form made in .pdf designer Take detailed notes
BrowardCounty Government Emissions Inventory Accounts for: GHG emissions in baseline year 1997 GHG reductions achieved by the County from 1997 to 2007 GHG emissions forecast (BAU) through target year 2015
Gov. GHG Emissions Inventory Source Categories 1. Buildings - GHG emissions generated through the use of electricity and other fuels. 2. Vehicle Fleet –GHG emissions generated from the use of fuel for the operation of County owned or leased vehicles. 3. Employee Commute –GHG emissions generated by the commute of County government employees to and from their work.
Gov. GHG Emissions Inventory Source Categories 4. Streetlights –emissions generated by the consumption of energy (usually electricity) by Broward County operated streetlights. 5. Water/Sewage –emissions generated by the consumption of energy (usually electricity) in water and sewage treatment plants and pump stations. 6. Waste –emissions generated by the disposal of waste generated by Broward County Government Operations. 7. Other – Other Broward County owned or operated sources of GHG emissions were considered for this source.
Data Needs: Buildings Data Needed: Fuel usage by fuel type for each building and/or facility • Electricity • Natural gas (therms, thousand cubic feet, etc.) • Fuel Oil (gallons) • Propane Data Sources: Utility accounts depicting total fuel use for each government building and facility Total fuel costs for each fuel type (optional but useful)
Data Needs: Vehicle Fleet Data Needed: Fuel consumption by fuel type or annual mileage, vehicle type, and fuel type Data Sources: Fuel usage records (gasoline, ULSD, CNG, Biodiesel, etc.) Common Types of Government Vehicle Fleet: Passenger Vehicles Light, medium, and heavy duty trucks Vanpool Van Transit vehicles
Broward County Transit Hybrid Bus Fleet Vehicle powered by CNG Savings in fuel cost = $82,000/year Toyota Prius Hybrid Electric Fleet Vehicle
Data Needs: Employee Commute Data Needed: Fuel consumption by fuel type or annual mileage, vehicle type, and fuel type Data Sources: Analysis of commuter patterns, employee surveys, etc. Types of vehicles: Passenger Vehicles Light, medium, and heavy duty trucks Vanpool Van
Data Needs: Streetlights Data Needed: Fuel usage by fuel type • Electricity • Green Electricity Data Sources: Utility accounts depicting total fuel use for each county owned traffic lights, traffic signals and street signs Total fuel costs for each fuel type (optional but useful)
Data Needs: Water/Sewage Data Needed: Fuel usage by fuel type for each facility • Electricity • Natural gas (therms, thousand cubic feet, etc.) • Fuel Oil (gallons) • Propane • Green Electricity Data Sources: Utility accounts depicting total fuel use for each facility Total fuel costs for each fuel type (optional but useful)
DataNeeds: Waste Data Needs: Waste type, waste amount, haulage/tipping costs, waste disposal technology. Data Sources: waste disposal amount reported May need the number of employees to estimate the amount per employee. Waste type can be determined using composition studies
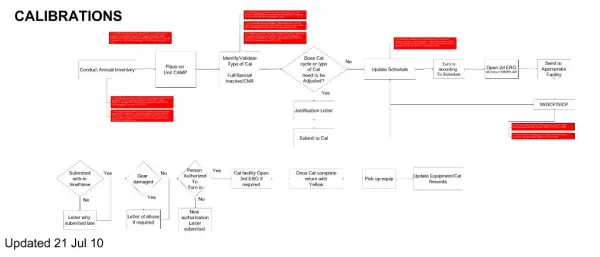
Government Operations GHG Emissions Inventory Using the CACP Software
Government Operations GHG Emissions Inventory Data tracking and collection • Document sources of data, contacts and assumptions
Projections Indicators Buildings: Projected buildings’ square footage for target year Vehicle Fleet: Estimated fleet size by target year Employee Commute: Number of employees by target year Streetlights: Net growth of streetlights, traffic signals, & illuminated street signs Water & Sewage: percentage of electricity growth by target year Waste : Number of employees by target year
Accounting for Government Measures Measures implemented from 1997-2007. Data inputs provided by the Workgroup. Each quantifiable measure was entered into the CACP software to get the GHG emission reductions. CACP able to determine cost savings associated with the project and the payback period. Non-quantifiable measures were also listed in the Report with associated environmental benefits. Data can be exported to MS Excel for making graphs, and pie charts to enhance the way that the data is displayed.
Energy ConservationExample of Measures LED Traffic Signals – Cost savings for 3,000 traffic lights= $1.3 million/ year First LEED Building: Broward County South Regional Library- Cost Savings $31,000/year Building Retrofit Projects Cost Savings: $1.5 million/year Broward County Environmental Monitoring Lab - LEED Certified Building
BrowardCountyClimateChangeGovernmentOperations2009AnnualProgressReportBrowardCountyClimateChangeGovernmentOperations2009AnnualProgressReport • Board accepted the first Report, which recommended the annual progress report. • First Broward County Government Operations GHG Annual Progress Report was completed on May 26, 2009. • Describes actions BC government implemented during calendar year 2008 & progress towards achieving the reduction goal. • The Progress Report was used as a tool to show the annual reduction. BC met and exceeded the annual reduction of 10,184 tonnes eCO2 emissions. • The Progress Report was a 1 page summary Report which included an Appendix with detailed quantifiable and non-quantifiable measures for 2008.
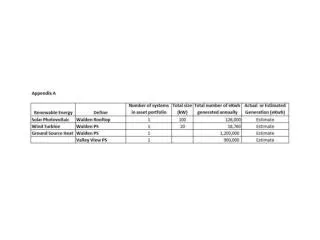
Government Operations Existing Measures The software quantifies measures designed to reduce GHG emissions.