Download
1 / 27
270 likes | 346 Views
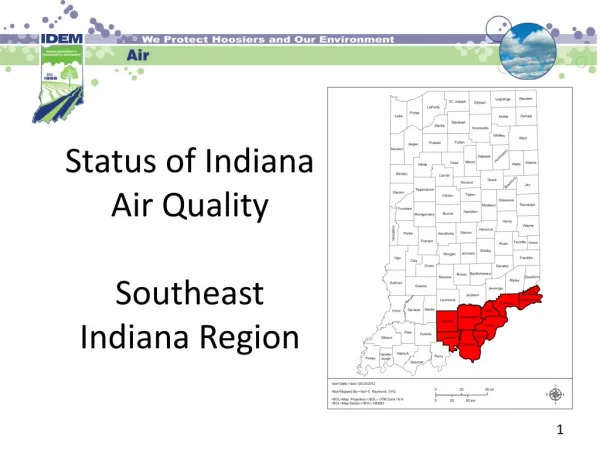
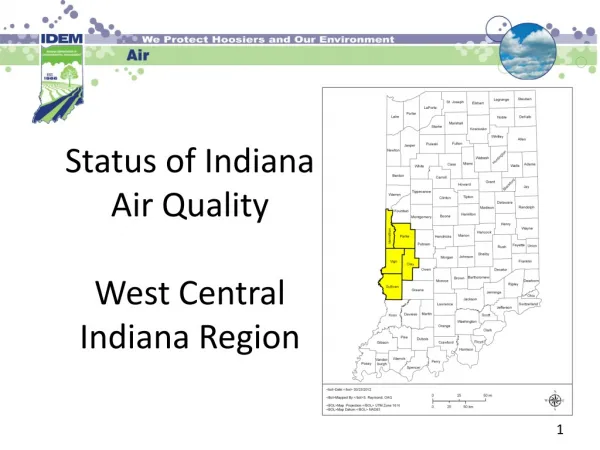
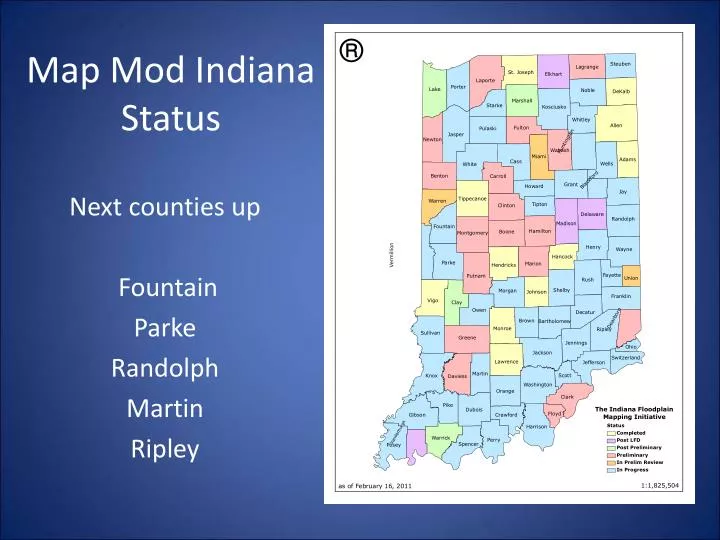
Map Mod Indiana Status. Next counties up Fountain Parke Randolph Martin Ripley. The Paradigm Shift: Map Mod to Risk MAP. What is Risk MAP?.

E N D
Map Mod IndianaStatus Next counties up Fountain Parke Randolph Martin Ripley
What is Risk MAP? Through collaboration with State, Local, and Tribal entities, Risk MAP will deliver quality datathat increases public awarenessand leads to action that reduces riskto life and property.
Risk MAP is Science Based Risk MAP is here because new science is available that enables FEMA to: • Develop reliable and accurate maps to identify communities’ risks • More fully assess the level of flood risk that communities face • Provide guidance to help communities develop better plans for mitigating risk • Arm communities with the tools and information needed to communicate about risk and mitigation more clearly and confidently to their constituents
Provides a more scientific, transparent approach to identify communities to study and map. Prioritize Projects Prioritization includes: • 2010: Based on risk, need, data availability • 2011: Based on algorithm of risk, need, community contribution Enables FEMA to: • Acquire data for future projects • Develop products for high risk, need areas • Leverage previous efforts • Consider stakeholder input • Provide technical assistance
Aligns FEMA with agencies and the scientific community who already use a watershed approach. Watershed Approach What is the Watershed Approach? • Uses the watershed as a study framework • Evaluation of need to include unstudied stream reaches connecting multiple studied stream reaches within a watershed • Areas for data processing may be identified on a watershed basis
Elevation Data Acquisition Increases the reliability of FEMA’s science to provide a more accurate picture of risk. Elevation data includes: • Inventory of existing elevation data • Acquisition of elevation data on a watershed basis based on risk, need, and contribution • Partnering to cost-share data acquisition and processing
Backed by better science, mitigation plans are more informed and actionable. Mitigation Planning Mitigation planning activities includes: • Local mitigation planning support • Revised guidance • Community incentives • Participation by nontraditional stakeholders in project lifecycle Products: • National repository for Mitigation Plans • Method to monitor risk reduction activities • National Community Toolkit for Hazard Mitigation Planning
The science behind Risk MAP provides the foundation for communicating about risk reduction. Risk Communications Risk communications includes: • Tools to strengthen community capability to communicate about risk • A foundation for local risk communications Improves communications: • Between FEMA and communities • Between communities in a watershed • Within communities Risk MAP Products: • Project communication assessment tool • Project communication planning tool • Customizable fact sheets
Risk MAP Products Flood Risk Database Changes Since Last FIRM Data Areas of Mitigation Interest Flood Risk Assessment Data Flood Depth & Analysis Grids Flood Risk Map Flood Risk Report Ad-Hoc Flood Risk Analyses
Risk MAP Datasets • Changes since last FIRM • Depth grids (10-, 25-, 50-, 100-, and 500-year) • Percent Annual Chance • Percent Chance over 30-years • Depth grids (2-, 5-, and 200-year) (enhanced product) • Depth grids (1%+) (enhanced product) • Velocity grids (enhanced product) • Annualized Depth (enhanced product)
Changes Since Last FIRM • Identify areas and types of SFHA change between current effective/previous SFHAs and proposed/new SFHAs • A visual comparison of old and new SFHAs • Offers stakeholders transparency
Changes Since Last FIRM Structures added
Flood Depth Grid • Increase flood risk awareness by communicating that risk varies within the mapped floodplain • Final product can include 2-, 5-, 10-, 25-, 50-, 100-, 200-, and 500-year events • Provides the necessary input for damage analysis
500-year Flood Depth Grid Above 500-yr but no access School (<1’) SR19 (2’) Hospital (<1’) Fields (10-15’) Neighborhoods (1-4’)
Percent Annual Chance 2% to 5% < 1% < 0.2% > 10%
Percent Chance Over 30 Years 76-99% chance (3 in 4 to almost 1 in 1 odds) 11-25% chance (1 in 10 to 1 in 4 odds) More than 1 in 4 odds 100% chance (1 in 1 odds)
Risk MAP Wabash River Discovery Meetings • Joint venture between Indiana DNR & Illinois State Water Survey • Includes Lower Wabash and Middle Wabash / Busseron Watersheds (HUC8) • Two “high level meetings” with federal / state stakeholders (Silver Jackets in Indiana Fall 2010) • Six local meetings with local stakeholders
Discovery meeting highlights • 6 separate meetings with local stakeholders(2 sets of 3, Washington, Bloomfield & Spencer) • 2 meetings with Indiana Silver Jacket team • 4 meetings were videotaped • Discovery report and Flood Risk Map
What is CNMS? • Goal: • Produce a National inventory database of flooding sources corresponding to our mapping inventory that: • Tracks program status on NVUE. • Informs map planning production decisions - References mapped flooding sources as valid or as having an unmet need. • Serve as FEMA’s mapping needs management system - MNUSS will be sunset. • Document accomplishments - Resolution date of existing mapping needs will be captured.
Coordinated Needs Management Strategy • Geospatial database of mapping needs • Includes all streams draining greater than 1 sq mi • DOW now working on final QA of initial data • Validation of selected counties to be complete by March 2011 • Used for planning for future mapping efforts
CNMS in FY11 and Beyond • FEMA Regional Funding Allocations will be influenced by CNMS data in FY11 • Completion of stream-level validation is critical • Continuous Lifecycle Validation • Annual maintenance cycle of validation information to monitor inventory decay rate based on 5-year assessment cycle • For example, starting in FY11 effective studies from FY06 should undergo validation process • Web-Based Application • Front-end application that allows easier interaction with CNMS data for non-GIS savvy users • Still being proposed at program level
Indiana Floodplain Information Portalinfip.dnr.in.gov • New interface and base map complete • 6 counties of flood elevation points complete • eFARAand floodplain ordinance support now operational