Download

1 / 127
1.27k likes | 1.45k Views
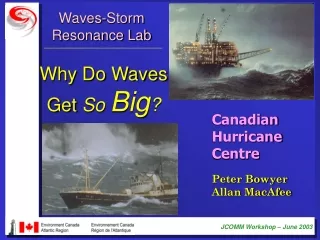
Waves-Storm Resonance Lab. Why Do Waves Get So Big ?. Canadian Hurricane Centre. Peter Bowyer Allan MacAfee. Between Oct. 91 and Sept. 95, EC’s East Coast NOMAD buoys reported some extraordinary waves events, with the 100-year waves being greatly exceeded 3 times in those 4 years.

E N D
Waves-Storm Resonance Lab Why Do Waves Get So Big? Canadian Hurricane Centre Peter Bowyer Allan MacAfee
Between Oct. 91 and Sept. 95, EC’s East Coast NOMAD buoys reported some extraordinary waves events, with the 100-year waves being greatly exceeded 3 times in those 4 years
“The Perfect Storm” - October 1991 “Storm of the Century” - March 1993 Hurricane Luis - September 1995 . . . each reported significant wave heights of 17+ metres, and maximum wave heights 30+ metres
Our work that has followed has focussed on the problem of “what makes big waves?”
Basics of Waves • l = cT
1 2 1 2 SPEED OF WAVES IN WATER ( ) g = gravitational constant c = gl tanh 2pd 2pl l = wavelength d = water depth In deep water, d / l gets very large, so tanh (big #) 1, therefore, c = gl 2p
SPEED OF WAVES IN DEEP WATER c = gT 2p l = gT 2p Sincel = cT 2 Therefore, speed (c) and wavelength (l) are only a function of period (T). Since the speed is a function of the period, deep water is a “dispersive” medium.
BASIC DEEP WATER WAVE FORMULAE c (m/s) = 1.56 T (sec) c (kts) = 3.03 T (sec) l (m) = 1.56 T (sec) l (ft) = 5.12 T (sec) S = H = H (m) l 1.56 T (sec) c = gT 2p 2 2 2
COMPOSITION OF WAVES Any observed wave pattern on the ocean can be shown to be comprised of a number of simple waves, which can differ from each other in height, wavelength and direction. The above profile is the result of two waves differing in l only.
COMPOSITION OF WAVES In reality, the sea is a superposition of many wave sets.
WIND-WAVES...depend on: • Wind speed - the speed of the wind • Fetch- the area of sea surface over which a wind of constant direction (within 30o) and steady speed is, or has been blowing • Duration- the length of time the wind persists from a certain fetch
SIGNIFICANT WAVE HEIGHTS Hsiga V2 tanh [a (F/V2)a] V = wind speed F = fetch length “Law of Diminishing Returns” is at work
FULLY DEVELOPED SEA SEA CHANGING TO SWELL RIPPLES CHOP WIND WAVES WIND FETCH of the wind
THE WAVE SPECTRUM ENERGY For a simple sine wave, the energy is proportional to the square of the wave height. However, the real sea is a combination of many sine waves of varying l and T. The simplest way of determining the “energy” of the sea is to examine the relative amounts of energy contained within different period ranges in the sea surface. The plot here of energy vs. frequency (1/T) is a typical energy (or wave) spectrum. PERIOD
WAVE SPECTRA FOR DIFFERENT WIND SPEEDS As wind speed is increased, not only is more energy available (higher wave heights), but longer waves (longer period or lower frequency) are also present. Also, the period of maximum energy shifts to longer period waves. 40 knots SPECTRAL ENERGY 30 knots 20 knots 10 60 20 5 PERIOD (sec)
WAVE ENERGY vs. WIND SPEED Wave energy is very sensitive to wind speed: Wave Energy (Wave Height) Wave Height (Wind Speed) Wave Energy (Wind Speed) 2 a 2 a 4 a Best Wave Model Uses “Good” Winds
STATISTICAL DESCRIPTION OF WAVE HEIGHTS H = significant wave height = average height of highest 1/3 waves in record (corresponds roughly to visually observed heights) H = average of all height values @ .625 H H = average height of (1/n)th highest waves H = 1.3 H H = 1.8 to 2.2 times the H SIG SIG AV 1/n 1/10 SIG SIG MAX
WAVE GROUPS Although individual crests advance at a speed corresponding to their wavelength (as a coherent unit), the group advances at its own speed, called the GROUP SPEED....Cg. The group speed is the speed at which the energy propagates (moves with the speed of the “middle” of the pack...slower than leading waves and faster than trailing waves.) The energy is equally split between KE and PE, however, the KE is associated with movement of particles in nearly closed orbits....therefore, the KE is not propagated. The PE is associated with net displacements of particles and this moves along with the wave at the wave speed.
WAVE GROUPS Therefore, only1/2 of the energy (PE) is propagated at the wave speed which is the same as the total energy moving at 1/2 of the wave speed. C (kts) = C = 1.51 T (sec) 2 g
TYPICALWAVEPERIODS Period (sec) Group Speed (kts) 5 8 6 9 7 11 8 12 9 14 6m waves developed by a marginal gale 10 15 11 17 12 18 13 20 14 21 15 23 16 24 16m “fully-developed” seas in a big storm 17 26 18 27 19 29 Long swell well ahead of a storm system 20 30
STATIONARY FETCHES - Example 1 Coast-lines- The fetch at point B is the distance AB. The fetch at point D is the distance CD. Since AB > CD, a wind from the coast would generate greater waves at B than at D because of the proximity of the coastline.
STATIONARY FETCHES - Example 2 Curvature- The fetch at point B is limited by the curvature of the flow upwind. The fetch is now the distance upwind from B to the point where the wind direction becomes more than 30o different from that at B.
STATIONARY FETCHES - Example 3 Fanning out of flowThe fetch at point B is limited by the fanning out of the isobars upstream, therefore giving decreasing wind speeds. In this case, the criterion that is recommended is for wind-speed reductions > 20%.
Moving Fetches Most interesting wind systems are not stationary. Determining fetches in a moving system can be complex and time consuming. As it turns out, the determination of the fetch is as critical as the determination of the wind speed
Cyclone Motion O X WIND 1 1 3 4 3 4 WIND WIND 2 2 WIND
1 O X Time T0 Winds Perpendicular to Fetch Motion . . PC PD . PB . PE . PA
1 O X Time T1 Waves from PA & PC & PE grew for less than 1 time-step before moving outside the fetch Waves from PB & PD have grown for 1 time-step Winds Perpendicular to Fetch Motion . . . . PC PD . . PB . . . . PE PA
1 O X Time T2 Waves from PB moved outside the fetch after 1 time-step Waves from PD grew for almost 2 time-steps Winds Perpendicular to Fetch Motion . . . . . . PC PD . . . PB . . . . . . PE PA
O X 2 Time T0 Winds Perpendicular to Fetch Motion . . PC PD . PB . PE . PA
O X 2 Time T1 Winds Perpendicular to Fetch Motion Waves from PA & PD & PE grew for less than 1 time-step before moving outside the fetch Waves from PC & PB have grown for 1 time-step . . . . PC PD . . PB . . PE . . PA
O X 2 Time T2 Waves from PB moved outside the fetch after 1 time-step Waves from PC have grown for 2 time-steps Winds Perpendicular to Fetch Motion . . . . . . PC PD . . . PB . . . PE . . . PA
O X Time T3 2 Winds Perpendicular to Fetch Motion Waves from PC grew for more than 2 time-steps before moving outside the fetch . . . . . . . . PC PD . . . . PB . . . . PE . . . . PA
Time T0 Winds Opposing Fetch Motion O 3 X . . PC PD . PB . PE . PA
Time T1 Waves from PC & PD grew for 1 time-step Waves from PE & PB & PA grew for less than 1 time-step before moving outside the fetch Winds Opposing Fetch Motion O 3 X . . PC . PD . . PB . . . PE . . PA . .
Time T2 Waves from PC & PD moved outside the fetch before growing for even 2 time-steps Winds Opposing Fetch Motion O 3 X . . PC . PD . . . PB . . . PE . . . PA . . .
Time T0 Winds With Fetch Motion O 4 X . . PC PD . PB . PE . PA
Time T1 Waves from PA fell behind the fetch before even 1 time-step Winds With Fetch Motion O 4 X . . . . PC . PD . . PB . . PE . PA
Time T2 Waves from PE grew for more than 1 time-step but were then outrun by the fetch Winds With Fetch Motion O 4 X . . . . . . . PC . . PD . . . PB . . PE . PA
Time T3 Waves from PC & PB & PD are still growing after 3 time-steps . . . although those from PB will soon be outrun by the fetch Winds With Fetch Motion O 4 X . . . . . . . . . . . PC . . . PD . . . PB . . PE . PA
Time T4 Waves from PC & PD are still growing after 4 time-steps Winds With Fetch Motion O 4 X . . . . . . . . . . . . . . . . PC . . . PD . . . PB . . PE . PA
Time T5 Winds With Fetch Motion . O Waves from PD were finally outrun by the fetch after more than 4 time-steps Waves from PC are still growing after 5 time-steps 4 X . . . . . . . . . . . . . . . . . . . . PC . . . PD . . . PB . . PE . PA
“Fetch Reduction” always occurs in Quadrants 1-2-3 . . . as long as the cyclone is moving
“Fetch Enhancement” may occur in Quadrant 4 . . . depending on the speed of the cyclone
Waves Moving in Same Directionas Their StormPotential for Resonance
A Fetch moving much faster than waves Mid-latitude systems
A B Fetch moving much faster than waves Mid-latitude systems Waves moving much faster than fetch Tropical storms in the tropics
A B C Fetch moving much faster than waves Mid-latitude systems Waves moving much faster than fetch Tropical storms in the tropics Some waves in harmony with fetch Strong wind systems in mid-latitudes