Download
1 / 30
310 likes | 402 Views
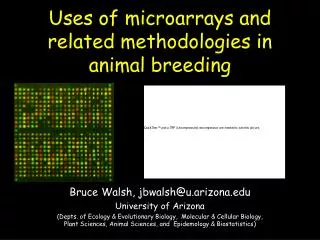
Uses of microarrays and related methodologies in animal breeding. Bruce Walsh, jbwalsh@u.arizona.edu University of Arizona (Depts. of Ecology & Evolutionary Biology, Molecular & Cellular Biology, Plant Sciences, Animal Sciences, and Epidemology & Biostatistics).

E N D
Uses of microarrays and related methodologies in animal breeding Bruce Walsh, jbwalsh@u.arizona.edu University of Arizona (Depts. of Ecology & Evolutionary Biology, Molecular & Cellular Biology, Plant Sciences, Animal Sciences, and Epidemology & Biostatistics)
The basic idea behind gene expression arrays • With a complete (or partial) genome sequence in hand, one can array sequences from genes of interest on small chip, glass slide, or a membrane • mRNA is extracted from cells of interest and hybridized to the array • Genes showing different levels of mRNA can be detected
Types of microarrays • Synthetic oligonucleotide arrays • Chemically synthesize oligonucleotide sequences directly on slide/chip/membrane (e.g., using photolithography) • Affymetrix, Agilent • Spotted cDNA arrays • PCR products from clones of genes of interest are spotted on a glass slide using a robot • Extracted cellular mRNA is reverse-transcribed into cDNAs for hybridization
Cell type 2 Cell Type 1 The color of the spot corresponds to the relative concentrations of mRNAs for that gene in the two cell types
mRNAs from these Genes of roughly equal Abundance in both cell types mRNAs from these genes more abundant in cell type 1 mRNAs for these genes more abundant in cell type 2
Analysis of microarray data • Image processing and normalization • Detecting significant changes in expression • Clustering and classification • Clustering: detecting groups of co-expressed genes • Classification: finding those genes at which changes in mRNA expression level predict phenotype
Array k Replicate l in array k Genej Treatment i Interaction between gene i and treatment j k-th spotting of gene j under treatment i on replicate l of array k Significance testing-- GLM Yklijk = u + Ak +Rkl + Ti + Gj + TGij +elkijk
Problem of very many tests (genes) vs. few actual data vectors • Expectation: A large number of the GxT interactions will be significant • Controlling experiment-wide p value is very overly conservative (further, tests may be strongly correlated) • Generating a reduced set of genes for future consideration (data mining) • FDR (false discovery rate) • PFP (proportion of false positives) • Empirical Bayes approaches
Which loci control array-detected changes in mRNA expression? • Cis-acting factors • Control regions immediately adjacent to the gene • Trans-acting factors • Diffusable factors unlinked (or loosely linked) to the gene of interest • Global (Master) regulators • Trans-acting factors that influence a large number of genes
David Treadgill’s (UNC) mouse experiment • Recombinant Inbred lines from a cross of DBA/2J and C57BL • The level of mRNA expression (measured by array analysis) is treated as a quantitative trait and QTL analysis performed for each gene in the array
CIS-modifiers MASTER modifiers TRANS-modifiers Distribution of >12,000 gene interactions Genomic location of genes on array Genomic location of mRNA level modifiers
Candidate loci : Differences in Gene Expression between lines • Correlate differences in levels of expression with trait levels • Map factors underlying changes in expression • These are (very) often trans-acting factors • Difference between structural alleles and regulatory alleles
Expanded selection opportunities offered by microarrays • G x E • Candidate genes may be suggested by examining levels of mRNA expression over different major environments • With candidates in hand, potential for selection of genes showing reduced variance in expression over critical environments • Breaking (or at least reducing) potentially deleterious genetic correlations • Look for variation in genes that have little (if any) trans-acting effects on other genes
Towards the future • Selection decisions using information on gene networks / pathways • Microarrays are one tool for reconstructing gene networks • Tools for examining protein-protein interactions • Two hybrid screens • FRET & FRAP
Analysis and Exploitation of Gene and Metabolic Networks • Graph theory • Most estimation and statistical issues unresolved • Major (current) analytic tool: Kascer-Burns Sensitivity Analysis
Kascer-Burns Sensitivity Analysis(aka. Metabolic Control Analysis) “No theory should fit all the facts because some of the facts are wrong” (N. Bohr) “All models are wrong, although some models are Useful” (Box)
Flux = production rate of a particular product, here F Perhaps we increase the concentration of e1 However, it may be more efficient To increase the concentration of e4 The flux control coefficient, introduced by Kascer and Burns, provides a quantitative solution to this problem How best to increase the flux through this pathway?
The control coefficient for the flux at step j in a pathway associated with enzyme j, Flux Control Coefficients, Roughly speaking, the control coefficient is the percentage change in flux divided by percentage change in enzyme activity
Why many mutations are recessive: a 50% reduction in activity (the heterozygote) results in only a very small change in the flux When the activity of E is large, C is close to zero When the activity of E is near zero, C is close to 1
Kacser-Burns Flux summation theorem: • Coefficients are not intrinsic properties of an enzyme, but rather a (local) system property • If a control coefficient is greatly increased in value, this decreases the values of other control coefficients • While most values of C for proteins are positive, negative regulators (repressors) give negative values, allowing for C values > 1. • Truly rate-limiting steps are rare
Small-Kacser theorem: the factor f by which flux is increased by an r-fold increase in activity of E is Hence, the limiting increase in f is “rate-limiting” steps in pathways
Using estimated Control Coefficients as selection aids • Loci with larger C values should respond faster to selection • Such loci are obvious targets for screens of natural variation (candidate loci) • Selection with reduced correlations • Tallis or Kempthorne - Nordskog restricted selection index • Select on loci with large C for flux of interest, smallest C for other fluxes not of concern • Positive selection on C for flux of interest, selection to reduce flux changes in other pathways
We wish this flux to remain unchanged The initial approach might be to try either e3 or e4, rather than e1 or e2 Flux we wish to increase A more correct approach, however is to Pick the step(s) that maximize CF while minimizing CH
Index selection on pathways • The elements of selection include both phenotype and C, and (possibly) marker markers as well • Problems: • C is a local estimate, changing as the pathway evolves • Still have all the standard concerns with a selection index (e.g., stability of inverse of genetic covariance matrix) • These are important caveats to consider even under the rosy scenaro where all C’s are know
What to call it? MAS = Marker Assisted Selection CAS = Control Coefficient Assisted Selection CASH $ = Control Activity Selection Helper
Summary • Microarray analysis = data mining • Potential (immediate) useage: • Suggesting candidate loci • More efficient use of G X E • Reducing/breaking deleterious correlations • Cis (easy) vs. trans (hard) control of expression levels • Future = analysis of pathways • Index selection (and all its problems)
Farewell from the “desert” U of A Campus