Download
1 / 4
40 likes | 115 Views
A Survey for Large Separation Lensing Among 9100 FIRST Quasars. 1,2. 2. 4. 1. 3. 1- School of Physics and Astronomy and Wise Observatory, Tel-Aviv University, Tel-Aviv 69978, Israel 2-Max-Planck-Institut fr Astronomie, K צ nigstuhl 17, D-69117 Heidelberg, Germany

E N D
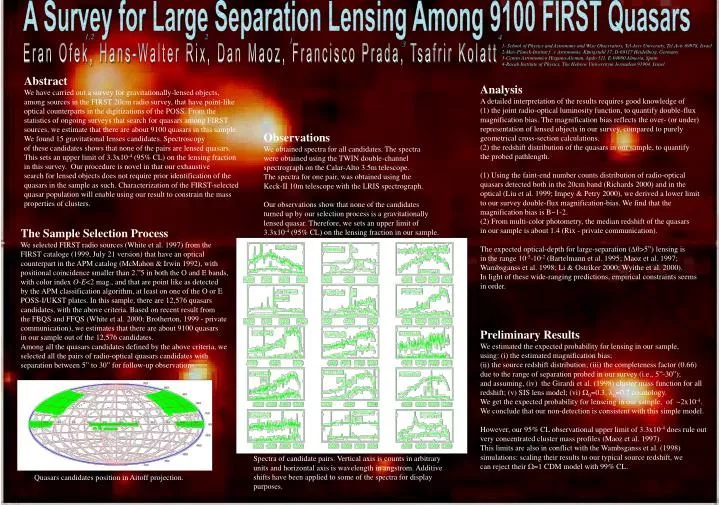
A Survey for Large Separation Lensing Among 9100 FIRST Quasars 1,2 2 4 1 3 1- School of Physics and Astronomy and Wise Observatory, Tel-Aviv University, Tel-Aviv 69978, Israel 2-Max-Planck-Institut fr Astronomie, Kצnigstuhl 17, D-69117 Heidelberg, Germany 3-Centro Astronomico Hispano-Aleman, Apdo 511, E-04080 Almeria, Spain 4-Racah Institute of Physics, The Hebrew Universitym Jerusalem 91904, Israel Eran Ofek, Hans-Walter Rix, Dan Maoz, Francisco Prada, Tsafrir Kolatt Abstract We have carried out a survey for gravitationally-lensed objects, among sources in the FIRST 20cm radio survey, that have point-like optical counterparts in the digitizations of the POSS. From the statistics of ongoing surveys that search for quasars among FIRST sources, we estimate that there are about 9100 quasars in this sample. We found 15 gravitational lenses candidates. Spectroscopy of these candidates shows that none of the pairs are lensed quasars. This sets an upper limit of 3.3x10⁻⁴ (95% CL) on the lensing fraction in this survey. Our procedure is novel in that our exhaustive search for lensed objects does not require prior identification of the quasars in the sample as such. Characterization of the FIRST-selected quasar population will enable using our result to constrain the mass properties of clusters. Analysis A detailed interpretation of the results requires good knowledge of (1) the joint radio-optical luminosity function, to quantify double-flux magnification bias. The magnification bias reflects the over- (or under) representation of lensed objects in our survey, compared to purely geometrical cross-section calculations. (2) the redshift distribution of the quasars in our sample, to quantify the probed pathlength. (1) Using the faint-end number counts distribution of radio-optical quasars detected both in the 20cm band (Richards 2000) and in the optical (Liu et al. 1999; Impey & Petry 2000), we derived a lower limit to our survey double-flux magnification-bias. We find that the magnification bias is B~1-2. (2) From multi-color photometry, the median redshift of the quasars in our sample is about 1.4 (Rix - private communication). The expected optical-depth for large-separation (Dq>5”) lensing is in the range 10-5-10-2 (Bartelmann et al. 1995; Maoz et al. 1997; Wambsganss et al. 1998; Li & Ostriker 2000; Wyithe et al. 2000). In light of these wide-ranging predictions, empirical constraints seems in order. Preliminary Results We estimated the expected probability for lensing in our sample, using: (i) the estimated magnification bias; (ii) the source redshift distribution; (iii) the completeness factor (0.66) due to the range of separation probed in our survey (i.e., 5”-30”); and assuming, (iv) the Girardi et al. (1998) cluster mass function for all redshift; (v) SIS lens model; (vi) W0=0.3, l0=0.7 cosmology. We get the expected probability for lenseing in our sample, of ~2x10⁻⁴. We conclude that our non-detection is consistent with this simple model. However, our 95% CL observational upper limit of 3.3x10⁻⁴ does rule out very concentrated cluster mass profiles (Maoz et al. 1997). This limits are also in conflict with the Wambsganss et al. (1998) simulations: scaling their results to our typical source redshift, we can reject their W=1 CDM model with 99% CL. Observations We obtained spectra for all candidates. The spectra were obtained using the TWIN double-channel spectrograph on the Calar-Alto 3.5m telescope. The spectra for one pair, was obtained using the Keck-II 10m telescope with the LRIS spectrograph. Our observations show that none of the candidates turned up by our selection process is a gravitationally lensed quasar. Therefore, we sets an upper limit of 3.3x10⁻⁴ (95% CL) on the lensing fraction in our sample. The Sample Selection Process We selected FIRST radio sources (White et al. 1997) from the FIRST cataloge (1999, July 21 version) that have an optical counterpart in the APM catalog (McMahon & Irwin 1992), with positional coincidence smaller than 2.”5 in both the O and E bands, with color index O-E<2 mag., and that are point like as detected by the APM classification algorithm, at least on one of the O or E POSS-I/UKST plates. In this sample, there are 12,576 quasars candidates, with the above criteria. Based on recent result from the FBQS and FFQS (White et al. 2000; Brotherton, 1999 - private communication), we estimates that there are about 9100 quasars in our sample out of the 12,576 candidates. Among all the quasars candidates defined by the above criteria, we selected all the pairs of radio-optical quasars candidates with separation between 5” to 30” for follow-up observations. Spectra of candidate pairs. Vertical axis is counts in arbitrary units and horizontal axis is wavelength in angstrom. Additive shifts have been applied to some of the spectra for display purposes. Quasars candidates position in Aitoff projection.
Analysis A detailed interpretation of the results requires good knowledge of (1) the joint radio-optical luminosity function, to quantify double-flux magnification bias. The magnification bias reflects the over- (or under) representation of lensed objects in our survey, compared to purely geometrical cross-section calculations. (2) the redshift distribution of the quasars in our sample, to quantify the probed pathlength. (1) Using the faint-end number counts distribution of radio-optical quasars detected both in the 20cm band (Richards 2000) and in the optical (Liu et al. 1999; Impey & Petry 2000), we derived a lower limit to our survey double-flux magnification-bias. We find that the magnification bias is B~1-2. (2) From multi-color photometry, the median redshift of the quasars in our sample is about 1.4 (Rix - private communication). The expected optical-depth for large-separation (Dq>5”) lensing is in the range 10-5-10-2 (Bartelmann et al. 1995; Maoz et al. 1997; Wambsganss et al. 1998; Li & Ostriker 2000; Wyithe et al. 2000). In light of these wide-ranging predictions, empirical constraints seems in order. Priliminary Results (1) We estimated the expected probability for lensing in our sample, using: (i) the estimated magnification bias; (ii) the source redshift distribution; (iii) the completeness factor (0.66) due to the range of separation probed in our survey (i.e., 5”-30”); and assuming, (iv) the Girardi et al. (1998) cluster mass function for all redshift; (v) SIS lens model; (vi) W0=0.3, l0=0.7 cosmology. We get the expected probability for lenseing in our sample, of ~2x10⁻⁴. Therefore, with this simple model and our 95% CL observational upper limit of 3.3x10⁻⁴ for the lensing probability in our sample, it is not possible to constrain the parameter space. (2) Based on Wambsganss et al. (1998) simulations, and scaling their results to our typical source redshift, we can reject their W=1 CDM model with 99% CL.
The Sample Selection Process We selected FIRST radio sources (White et al. 1997) from the FIRST cataloge (1999, July 21 version) that have an optical counterpart in the APM catalog (McMahon & Irwin 1992), with positional coincidence smaller than 2.”5 in both the O and E bands, with color index O-E<2 mag., and that are point like as detected by the APM classification algorithm, at least on one of the O or E POSS-I/UKST plates. In this sample, there are 12,576 quasars candidates, with the above criteria. Based on recent result from the FBQS and FFQS (White et al. 2000; Brotherton, 1999 - private communication), we estimates that there are about 9100 quasars in our sample out of the 12,576 candidates. Among all the quasars candidates defined by the above criteria, we selected all the pairs of radio-optical quasars candidates with separation between 5” to 30” for follow-up observations. Observations We obtained spectra for all candidates. The spectra were obtained using the TWIN double-channel spectrograph on the Calar-Alto 3.5m telescope. The spectra for one pair, was obtained using the Keck-II 10m telescope with the LRIS spectrograph. Our observations show that none of the candidates turned up by our selection process is a gravitationally lensed quasar. Therefore, we sets an upper limit of 3.3x10⁻⁴ (95% CL) on the lensing fraction in our sample.
Analysis A detailed interpretation of the results requires good knowledge of (1) the joint radio-optical luminosity function, to quantify double-flux magnification bias. The magnification bias reflects the over- (or under) representation of lensed objects in our survey, compared to purely geometrical cross-section calculations; and (2) the redshift distribution of the quasars in our sample, to quantify the probed pathlength. (1) Using the faint-end number counts distribution of radio-optical quasars detected both in the 20cm band (Richards 2000) and in the optical (Liu et al. 1999; Impey & Petry 2000), we derived a lower limit to our survey double-flux magnification-bias. We find that the magnification bias is larger than unity. (2) The median redshift of the quasars in our sample is about 1.4 (Rix - private communication) Priliminary Results (1) Starting with the 3.3x10⁻⁴ (95% CL) upper limit on the probability for lensing in our survey, and using: (i) the magnification bias lower limit; (ii) our quasars redshift distribution; (iii) the completeness factor (0.66) due to the range of separation probed in our survey (i.e., 5”-30”); and assuming, (iv) the Girardi et al. (1998) clusters mass function; (v) SIS lens model; (vi) W0=0.3, l0=0.7 cosmology. We get a lower limit for the expected probability for lensed quasars in our sample, of > 1.3x10⁻⁴. (2) Based on Wambsganss et al. (1998) simulations, and scaling their results to our typical source redshift, we can reject the CDM model with 99% CL.