Download
1 / 26
270 likes | 421 Views
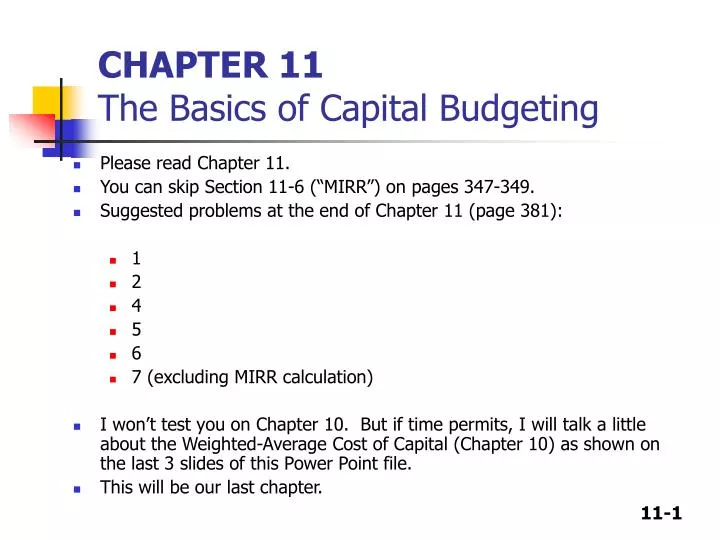
CHAPTER 11 The Basics of Capital Budgeting. Please read Chapter 11. You can skip Section 11-6 (“MIRR”) on pages 347-349. Suggested problems at the end of Chapter 11 (page 381): 1 2 4 5 6 7 (excluding MIRR calculation)

E N D
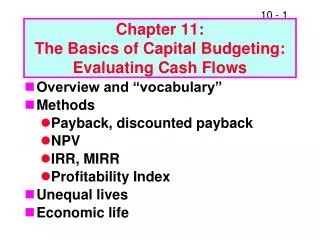
CHAPTER 11The Basics of Capital Budgeting • Please read Chapter 11. • You can skip Section 11-6 (“MIRR”) on pages 347-349. • Suggested problems at the end of Chapter 11 (page 381): • 1 • 2 • 4 • 5 • 6 • 7 (excluding MIRR calculation) • I won’t test you on Chapter 10. But if time permits, I will talk a little about the Weighted-Average Cost of Capital (Chapter 10) as shown on the last 3 slides of this Power Point file. • This will be our last chapter.
What is capital budgeting? • The process of planning expenditures on assets whose cash flows are expected to extend beyond one year. • Typically long-term decisions; involve large expenditures. • Very important to firm’s future. Examples: • Build a new refinery • Modify a process unit within an existing refinery • Modify an Apple factory production line to make new product • Open a new Target store location
Important difference between independent and mutually exclusive projects Independent projects: • 2 projects’ cash flows do not affect each other. Examples: • Build a plant to make solar panels • Build a plant to make wind energy motors Mutually exclusive projects: • Only one of the projects can be done. Example: • Build a plant at a specific location that is only large enough to produce either make solar panels OR wind energy motors
Steps to capital budgeting 1) Estimate all expected after-tax cash flows (CFs), including when they will occur. - Positive cash flows are money received and called “inflows” - Negative cash flows are expenditures and are called “outflows” 2) Assess the risk of the project - Some projects will be riskier than the company’s normal business, some will be about the same risk, and others may be less risky. 3) Determine the appropriate cost of capital. - For projects that have the same risk level as the company’s normal business, use the weighted-average cost of capital (WACC). - For riskier projects, adjust WACC up; less risky projects, adjust WACC down. 4) Calculate NPV and/or IRR. Accept project if NPV > 0 and/or IRR > WACC.
Net Present Value (NPV) • Sum of the PVs of all cash inflows and outflows of a project: • The first cash flow occurs at time t = 0. By definition, this is when the project’s CFs begin. For a project that will be started in 2011, the year 2011 is t = 0 on the time line. • Often the cash flow at t = 0 is negative.
Example: Project L in the Integrated Case (page 385)Project L is an ignition system line. Initial cost would be $100 million. Project would produce positive net cash flows for 3 years.The company estimates its WACC is 10%. We can write Project L’s Cash Flows on a Time Line 3 0 1 2 80 CFt-100 10 60 Calculate the NPV for Project L:
Calculating Project L’s NPV YearCFtPV of CFt 0 -100 -$100 1 10 9.09 2 60 49.59 3 80 60.11 NPVL = $18.79
Solving for NPV:Financial calculator solution • Enter CFs into the calculator’s CFLO register. • CF0 = -100 • CF1 = 10 • CF2 = 60 • CF3 = 80 • Enter I/YR = 10, press NPV button to get NPVL = $18.78.
Rationale for the NPV method NPV = PV of inflows – PV of outflows (i.e., Costs) = Net gain in wealth for company and investors If projects are independent: • Accept any project that has NPV > 0. If projects are mutually exclusive: • Accept project that has the highest positive NPV; it adds the most value to the company.
Internal Rate of Return (IRR) • IRR is the discount rate that forces PV of inflows equal to cost; NPV = 0: • Solving for IRR with a financial calculator: • Enter CFs in CFLO register. • Press IRR. • For out Project L example: IRR = 18.13%. • Note: a project’s IRR is similar to a bond’s YTM.
Rationale for the IRR method • If IRR > WACC, the project’s return exceeds its costs and there is some return left over to boost stockholders’ returns. If IRR > WACC, accept project. If IRR < WACC, reject project. • If projects are independent: • Accept any project that has IRR > WACC. • If projects are mutually exclusive: • Accept project that has the highest IRR if IRR > WACC.
NPV Profiles • A graphical representation of project NPVs at various different costs of capital. • For example Project L, calculate NPV at various WACC: WACC NPV 0 $50 5 33 10 19 15 7 20 (4)
Drawing NPV profiles: Example Project L NPV ($) 60 . 50 40 . 30 . IRRL = 18.1% 20 10 L . . WACC(%) or Discount Rate (%) 0 5 15 20 23.6 10 -10
Drawing NPV profiles:Example: 2 Projects “L” and “S” NPV ($) 60 . 50 . 40 . Crossover Point at discount rate = 8.7% . 30 . . IRRL = 18.1% 20 . . S . 10 L IRRS = 23.6% . . WACC(%) or Discount Rate (%) 0 5 15 20 23.6 10 -10
Comparing the NPV and IRR methods • If projects are independent, the two methods always lead to the same accept/reject decisions. • If projects are mutually exclusive … • If WACC > crossover rate, the NPV and IRR methods lead to the same decision and there is no conflict. • If WACC < crossover rate, the NPV and IRR methods lead to different accept/reject decisions. • Crossover points occur because projects have different scale and timing of cash flows.
The NPV and IRR Methods use different reinvestment rate assumptions • NPV method assumes CFs are reinvested at the WACC. • IRR method assumes CFs are reinvested at IRR. • Assuming CFs are reinvested at the opportunity cost of capital is more realistic, so NPV method is the best. • NPV method should be used to choose between mutually exclusive projects. • A modification to the IRR method (MIRR) is a method that adjusts IRR to use the WACC for reinvestment. Complicated and we’ll skip it. When in doubt, just use NPV.
Payback period method • “Payback” is the number of years required to recover a project’s cost, or “How long does it take to get our money back?” • Calculated by adding project’s cash inflows to its cost until the cumulative cash flow for the project turns positive. • This was the simplest and earliest method used (40 years ago) for capital budgeting. • Some companies still use it, especially for short-lived projects.
Calculating payback for Project L Project L’s Payback Calculation 3 0 1 2 80 CFt-100 10 60 Cumulative -100 -90 50 -30 30 80 PaybackL = 2 + / = 2.375 years = PaybackL = 2.375 years
Strengths and weaknesses of payback method • Strengths • Provides an indication of a project’s risk and liquidity. • Easy to calculate and understand. • Weaknesses • Ignores the time value of money. • Ignores CFs occurring after the payback period.
Discounted payback period • Tries to address the TVOM weakness of the payback method. • Uses discounted cash flows rather than raw CFs. 3 0 1 2 10% CFt -100 10 60 80 PV of CFt -100 9.09 49.59 60.11 Cumulative -100 -90.91 18.79 -41.32 Disc PaybackL = 2 + / = 2.7 years = 41.32 60.11
0 1 2 WACC = 10% -800 5,000 -5,000 Example of Non-Normal Cash Flows (>2 sign changes): Project P has cash flows: CF0 = -$800, CF1 = $5,000, and CF2 = -$5,000. Find Project P’s NPV and IRR. • Enter CFs into calculator CFLO register. • Enter I/YR = 10. • NPV = -$386.78. • IRR = ERROR Why?
This project has more than Multiple IRRs:Use NPV Method instead of IRR Method! NPV IRR2 = 400% 450 0 WACC 100 400 IRR1 = 25% -800
Weighted-average cost of capital (“WACC”) • WACC is often used in capital budgeting for the cost of borrowing. • WACC is the weighted-average of the component costs of the company’s debt (“d”), preferred stock (“p”), and common stock (“s”). • WACC is calculated using the formula: WACC = wdrd(1-T) + wprp + wsrs • The weights (w’s) refer to the company’s capital structure weights. • The r’s refer to the cost of each component. • T is the company’s tax rate. The cost of debt (i.e., interest) is tax-deductible.
Weighted-average cost of capital (“WACC”) WACC = wdrd(1-T) + wprp + wsrs What are the component costs? • For rd: Use the YTM of the company’s bonds (Chapter 7) • For rp: Use the required return on the preferred stock (Chapter 9) • Perpetuity: rp = (Interest payment / Market Price of Preferred Stock) • For rs: Use the required return on the common stock (Chapter 9) • CAPM: rs = rRF + (rM – rRF) b or • DCF: rs = (D1 / P0) + g
WACC Example: A company has a target capital structure of 30% debt, 10% preferred stock, and 60% common stock (equity). Calculate its WACC if: • The company’s bonds have a YTM of 10%. • The company’s tax rate is 40%. • The company’s preferred stock has a required return of 9%. • Using Value Line beta, its economists’ forecasts of market risk premium, and the CAPM model, the company’s required return on its common stock is 14%. WACC = wdrd(1-T) + wprp + wcrs = 0.3(10%)(1-0.4) + 0.1(9%) + 0.6(14%) = 1.8% + 0.9% + 8.4% = 11.1%
A few final words on capital budgeting On slide 11-4 we outlined the 4 steps for capital budgeting. Re Step 2, we said to assess the risk of the project. - Some projects will be riskier than the company’s normal business, some will be about the same risk, and others may be less risky. Re Step 3, we said determine the appropriate cost of capital. - For projects that have the same risk level as the company’s normal business, use the weighted-average cost of capital (WACC). - For riskier projects, adjust WACC up; less risky projects, adjust WACC down. In practice, companies often define “high risk”, “medium risk”, and “low risk” rates to use for the planning cycle. They often adjust during the planning cycle as conditions change.