Download

1 / 41
410 likes | 549 Views
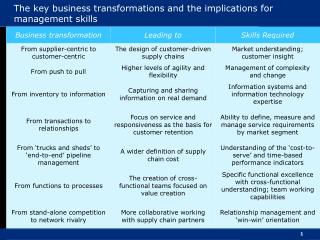
‘Room at the top?’ Implications of the hourglass labour market for earnings, mobility and skills. Craig Holmes. Department of Education public seminar, November 26 th 2012. Introduction. Skills policy across many countries is driven by two related economic concepts:

E N D
‘Room at the top?’ Implications of the hourglass labour market for earnings, mobility and skills Craig Holmes Department of Education public seminar, November 26th 2012
Introduction • Skills policy across many countries is driven by two related economic concepts: • Human capital theory (HCT): supply of skillsproductivity of labour forcewages and national output • Skill-biased technical change (SBTC): technical progressdemand for skills • The idea that there has been an increase in high-wage, high-skill jobs in the UK has been an attractive one for policymakers: • “There is…evidence that the demand for skilled workers is currently outstripping supply, which suggests there is 'room at the top' for highly qualified graduates from all backgrounds.” (HM Government, 2011, p. 11)
Introduction • Skills policy has become linked to reducing inequality • “As a result of low skills, Britain risks increasing inequality...skills are increasingly the key lever” Leitch Review of Skills final report, 2006 • In addition, some belief that higher supply can drive higher demand in an increasingly global market • Providing a country has a competitive advantage in available skills, firms will locate appropriate jobs there. • More and more higher-paid jobs – greater absolute upward mobility
Introduction • This view takes little account of the demand side of the labour market • Where it does, the situation is assumed to be accommodating • Key problems: • No sound basis for view that supply increases demand… • …therefore available jobs are largely exogenously determined. • Task-biased technical change rather than SBTC – increasing numbers of low skilled/low-wage jobs • Increasing variation amongst the broad category of skilled jobs • Career progression depends on recruitment strategies of employers
Outline of presentation • This presentation will discuss the following: • Occupational structure in Europe • Earnings distributions in the UK • Occupational mobility and occupational structure • Implications for skills policy
Occupational structure • Routinisation hypothesis (Autor, Levy and Murnane, 2003): • Price of computer capital has fallen since late 1970s • Computer capital replaces labour engaged in routine tasks • Non-routine tasks may be complementary to computer capital (e.g. management, skilled professionals) • Result: growth in non-routine occupations due to changes in demand (complementarities) and supply (displaced routine workers) • Polarisation hypothesis (Goos and Manning, 2007) • Routine occupations found in middle of income distribution • Non-routine occupations found at top and bottom of distribution • Managers, skilled professionals at the top • Non-routine ‘service’ occupations at the bottom e.g. hairdressers, cleaners
Occupational structure • Following Goos and Manning (2007), hourglass effect shown through changes in employment share of groups of occupations ranked by (initial) average wages – each of approx. 10% of labour supply. • Data : • New Earnings Survey 1986 (ranking wage) • Labour Force Survey 1981-2008 (employment shares) • Hours rather than headcount
Occupational structure • Growth in UK employment share, by ranked occupational group, 1981-2008
Occupational structure • UK is not a special case:
Occupations and wage distributions • What do compositional changes mean for the earnings distribution? • Quantile regression... but usually these are conditional, like OLS • Conditional regressions do not aggregate to unconditional quantile regressions, unlike OLS • Firpo, Fortin and Lemieux (2009) – henceforth FFL: • Counterfactual distribution estimated by reweighting • Composition effects: initialcounterfactual • Wage effects: counterfactualfinal • Estimates individual contribution of covariates to both
Occupations and wage distributions • Data used: • Family Expenditure Survey 1987-2001 • UK Quarterly Labour Force Survey 1995-2008 • Gross hourly wages (reported in LFS, derived in FES) • Occupations coded and grouped • Educational attainment by qualification (LFS) and year left FT schooling (FES)
Decomposing wage distributions • Narrow occupational codes seven occupational groups: • Professional • Managerial • Intermediate • Admin • Manual routine • Manual non-routine • Service High skill non-routine Routine occupations Low skill non-routine
Occupations and wage distributions • Composition effects: Source: Family Expenditure Survey, 1987-2001
A model of occupations and wages + increased between - + increased within - Initial wage structure Change: Composition group inequality group inequality wage Occupational group – area represents employment share
Occupations and wage distributions • Between group effects: Source: Family Expenditure Survey, 1987-2001, Labour Force Survey, 1995-2008
Occupations and wage distributions • Within-group effects: Source: Family Expenditure Survey, 1987-2001, Labour Force Survey, 1995-2008
Occupations and wage distributions • Interaction between occupations and education: Source: Family Expenditure Survey, 1987-2001, Labour Force Survey, 1995-2008
Occupations and wage distributions • Graduate “premia” across the distribution: Source: Family Expenditure Survey, 1987-2001
Occupations and wage distributions • “Room at the bottom?” • Highly qualified individuals increasingly found in lower wage service occupations (6.6%13.9% between 1995 and 2008)
Discussion • Increased heterogeneity within good non-routine jobs – average-of-group earnings have masked this and suggested a much more “room at the top”. • Consistent with Brown, Lauder and Ashton (2011): • Two labour markets for skilled workers (particularly graduates) • Top end – the “war for talent”. • Demand outstrips supply. • Barriers to entry based on elite university access. • The rest • rapidly increasing global supply outstripping demand • “digital Taylorism” reducing the skill content of good jobs. • Further routinisation in future?
Occupational mobility • Occupational structure also matters for mobility • Displaced workers from routine jobs • Changes in career paths towards good non-routine jobs • HCT would predict: • Workers with higher capabilities move “up” from routine occupations • Workers with routine-specific skills are less likely to move: • However, employer recruitment and progression routes affect individuals with similar HC in different ways • Therefore, demand side constraints and labour market institutions affect the relationship between occupational mobility and structure (Rhein and Trübswetter, 2012)
Occupational mobility • National Child Development Study (NCDS) • Members all born in a single week in March 1958 • Use waves 1981, 1991, 1999-2000, 2004-5 • Data covers age 23 to age 46-7 • N = 10-12,000 in each wave • British Cohort Study (BCS) • Members all born in a single week in April 1970. • Use waves 1992, 1996, 1999, 2004, 2008 • Data covers age 22 to age 38 • N = 9,000 in each wave
Occupational mobility • How has routinisation affected transitions from routine occupations? • Counterfactual dataset does not exist • Look at 4 or 5 year periods of transitions between 1981 and 2008 • Include a measure of routinisation using changes in employment share of routine workers across entire economy (LFS data)
Occupational mobility • Econometric analysis using logit model • One equation for each destination occupation (or out of work), conditional on starting in a routine occupation • Estimates the conditional probability that a routine worker makes a particular transitions. • Independent variables (baseline model): • Gender, ethnicity • Age, routine occupation experience • Qualifications (vocational and academic) • Displacement
Occupational mobility • Women are more mobile • Specific experience decreases mobility • Effect of age differs between cohorts – younger cohort becomes more mobile as they age • Age and routine experience combined increases mobility • Career progression (Sicherman and Galor, 1990)? • Structural unemployment? • More qualified are more mobile, particularly academic qualifications. More mixed picture for vocational qualifications
Occupational mobility • How much mobility is displacement? • Younger cohort is: • More mobile overall, but... • Less affected by displacement • Why?
Occupational mobility • Displacement including job and education interactions
Occupational mobility • Is this mobility upward, downward, or outwards?
Occupational mobility • Later cohort benefits from larger good non-routine group to move up to • Part of this results from turnover – difference between net and gross mobility • Occupational mobility of younger cohort does not support occupational structure change in the BCS cohort. • Points to a change in recruitment to good non-routine jobs experienced by the younger cohort – growth in good non-routine jobs does not create upward mobility opportunities.
Implications for skills policy • Above points to wider dispersion at the top – and less aggregate demand for skill • This dispersion issues comes on top of an increased supply of qualifications that might already have exceeded demand: • Living Futures (CBI, 2011): by 2017, 30% of sales and customer service occupations, 23% of personal service occupations and 24% of elementary occupations will “need a degree”.
Implications for skills policy • Falling demand for routine jobs changes skills demand at the intermediate level • UK often seen to have weakness in producing intermediate skills • Falling supply and demand = no problem?
Implications for skills policy • Intermediate skills, particularly vocational ones, may mediate shift in occupational structure • UK an outlier – HE graduates compensate? Source: Eurostat/EULFS
Conclusion • Skills policy – and hence policies towards reducing inequality and improving social mobility – is based around growing demand for skill creating “room at the top” • Absent of wage effects, the compositional shifts in the labour force support this • Considering wage effects and the “room at the bottom” point to a more mixed picture • Changing recruitment practices create mobility barriers for those looking to move up from employment • This evidence supports a view of the labour market where jobs and the demand side limit the importance of HCT.
Contact Details Craig Holmes ESRC Centre on Skills, Knowledge and Organisational Performance (SKOPE), Department of Education, Norham Gardens, Oxford Email: craig.holmes@education.ox.ac.uk
Appendix • Methodology slides for FFL • Managerial wage distributions
Decomposing wage distributions • Data: • N observations, N0 from initial distribution, N1 from final distribution • Ti = 1 if from final distribution, i = 1,...,N. Pr(Ti) = p • Yi and Xi observed • Yi = Yi0 (1 – Ti) + Yi1 Ti where Yit = gt(Xi, ei), t = 0,1 • Data can be reweighted to find the (unobserved) counterfactual distribution. • Counterfactual is wage distribution that would have arisen given initial wage determination process but final explanatory variables
Decomposing wage distributions • Reweighting: • where p(X) = Pr (T=1 | x = X) • Calculate p(X) using logistical regression • This counterfactual can be used to decompose wage and composition effects of a distributional statistic: • Let this statistic be represented by functional v(F) – e.g. percentile • Δv(F) = ΔvW + ΔvC
A quantile regression approach • FFL’s second contribution is to find a linear approximation of each distributional functional, conditional on the explanatory variables • An influence function, IF, of v(F) is a measure of sensitivity to outliers, where E(IF) = 0 • A recentered influence function, RIF = v(F) + IF, so E(RIF) = v(F) • RIF’s can be conditional on X • Assume a linear projection of RIF onto X: • where j = {0, C, 1}
A quantile regression approach • FFL show that: • ΔvC = E(X|T=1) γC - E(X|T=0) γ0 • ΔvW = E(X|T=1) (γ1 – γC) • Moreover, if expectation of RIF is linear, γC= γ0. • Composition effects are sum of change in composition of each explanatory variable, multiplied by wage return in initial distribution • Wage effect is sum of change in wage returns between counterfactual and final distribution, multiplied by final composition of each explanatory variable. • This is a more general case of the Blinder-Oaxaca decomposition, where v(F) is the mean.
A quantile regression approach • Our approach looks at quantiles across distribution • j = {0, C, 1} • τ = 0.05, 0.1, 0.15,...,0.95 • Estimate fi(qτ) using kernel density methods
A quantile regression approach • FFL’s second contribution is to break wage and composition effects into individual components e.g. occupation, education etc. • Method found in final paper, omitted here for time. • Idea is to find a linear approximation of each statistic in each distribution using explanatory variables: • Composition effects are sum of change in composition of each explanatory variable, multiplied by wage return in initial distribution • Wage is sum of change in wage returns between counterfactual and final distribution, multiplied by final composition of each explanatory variable.