Download

1 / 89
970 likes | 1.23k Views
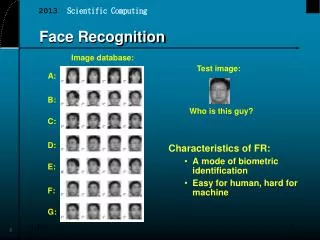
Face Recognition 2.1.2013. Presented by: Galit Levin. First Article: Face Recognition in Hyperspectral Images. . Zhihong Pan, Student Member, IEEE, Glenn Healey, Senior Member, IEEE, Manish Prasad, and Bruce Tromberg December 2003. The Problem.

E N D
Face Recognition2.1.2013 Presented by: Galit Levin.
First Article:Face Recognition in Hyperspectral Images . Zhihong Pan, Student Member, IEEE, Glenn Healey, Senior Member, IEEE, Manish Prasad, and Bruce Tromberg December 2003
The Problem • How to perform accurate Face Recognition in the presence of changes in facial pose and expression and over time intervals between images.
Current Face Recognition • Use spatial discriminants that are based on geometric facial features [3][4][5][6]. • Perform well on database acquired under controlled conditions. • Exhibit degradation in the presence of changes in face orientation.
Current Face Recognition • Perform poorly when subjects are imaged at different times. • Significant degradation in recognition performance for images of faces that are rotated more than 32 degrees!
Motivation • Accurate face recognition over time in the presence of changes in facial pose and expression. • Algorithm that performs better than current face recognition for rotated faces.
A Little Biology… • Epidermal – The outermost layers of cells in the skin. • Dermal – The layer between the epidermis and subcutaneous tissues. • Epidermal and Dermal layers of human skin contains several pigments: Melanin, Hemoglobin, Bilirubin and β- carotene. • Small changes in the distribution of the pigments include significant changes in the skin’s spectral reflectance!
Penetration Depth • Visible wavelengths are : 380 – 740 nm. • Near infrared wavelengths are : 750 – 2500 nm. • In the near-infrared (NIR) skin has larger penetration depth than for visible wavelengths. • Example: optical penetration of 3.57mm at 850nm and 0.48mm at 550nm. • Larger penetration enables characteristics that are difficult for a person to modify.
Spectral Change In Human Skin Right cheek of four subjects over NIR Differences in amplitude and shape.
And Now… The Same Object Different camera angles and poses.
Spectral Measurements NIR skin and hair reflectance. 2 subjects in a front view – illumination is the same for both!
Spectral Measurements NIR skin and hair reflectance 2 subjects in 90 degree side view.
Conclusions • Significant spectral variability from one subject to the other. • Spectral characteristics from one subject remain stable over a large change in face orientation. • Skin spectra differences are very pronounced. • Hair spectra differences also are noticeable and valuable for recognition.
Experiments • 200 human subjects using hyperspectral face images. • Each subject imaged (NIR) over a range of poses and expressions. • Several subjects imaged multiple times over several weeks. • Recognition is achieved by combining spectral measurements for different tissue types.
Experiments • All images were captured with 31 spectral bands separated by 0.01 nm over the NIR (700nm – 1000nm). • 2 light sources that provide uniform illumination on the subject.
Hyperspectral Bands 31 bands for one subject in ascending order – all used!
Spectral Reflectance Images • Main Idea: Convert the hyperspectral images to spectral reflectance images.
Spectral Reflectance Images • Two spectralon were used during calibration. • White spectralon : a panel with 99% reflectance. • Black spectralon : a panel with 2% reflectance. • Both panels have nearly constant reflectance over the NIR range.
Some Calculations… • Raw measurement obtained by hyperspectral imaging at coordinate (x,y) and wavelength λ. • L – illumination. • S – system spectral response. • R – reflectance of the viewed surface. • O – offset.
Some Calculations… • Image of white spectralon – • Same as for black spectralon. • Rw is the reflectance function of the white spectralon. • We average 10 images of white and black spectralon panels and estimate E(Iw), E(IB).
Some Calculations… • Now we can estimate L*S – And then estimate O. Now we can estimate R (of the subject) – Not dependent in L if L doesn’t change during the experiment.
Data Distribution – 200 subjects Diverse composition in term of gender, age and ethnicity.
Images Examples • 7 images for each subject, up to 5 tissue types. • Fg, fa – front view , neutral expression. • All fr’s are with rotations – 45 and 90 degrees. • 20 of the 200 were imaged at different times – up to 5 weeks.
Images Examples • Front view taken in 4 different visits.
Image Representation • Each face image is represented by spectral reflectance vectors. • These vectors are extracted from small facial regions – which are visible. • The regions are selected manually.
Image Representation 5 regions 2 regions
Spectral Reflectance Vector • Each reflectance vector of a region t and wavelength λ is estimated by averaging over the N pixels in the region. • Spectral reflectance vector for each facial region • Normalize.
Spectral Distance • The distance between face image I and face image J for tissue type t. • represents the B * B covariance matrix – variability for tissue type t over the entire database. • In our experiment, we use a single for the entire data.
Forehead Spectrum Larger variance at the ends of spectral range due to sensitivity to noise.
Concepts • Gallery (C) – group of hyperspectral images of known identity. Example : image fg. • Probes – The remaining images of the subject that are used to test the recognition algorithm. • Duplicates – The images taken in the second and subsequent sessions.
Our Experiments • Every image jin the probe set is present in the galleryas Tj. • Calculate D(i,j) For each i. j Є Probes , i Є C. • Hit – if D(Tj , j) is the smallest from all C distances.
Our Experiments • M1 – The number of correctly recognized probes. • Mn – The number of probes that D(Tj , j) is one of the n smallest of the C distances • N – The rank. • P – total number of probes.
Example • M2:
Experiments Skin is the most useful tissue – hair and lips are less! 90% of the probes were recognizes accurately – 200 images in the DB.
Reminder • fg is the gallery image. • fa, fb are the probe images.
Recognition Performance All tissue types, two probes. fa – same expression as the gallery, fb – different expression
Recognition using hyperSpectral discriminants is not impacted significantly by changes in facial expressions although it is harder to !identify
Recognition Performance Individual tissue types, two probes. Degradation pyramid – forehead , left + right cheek , lips
All Tissues Recognition Change in face orientation over all 200 images in DB. 75% recognition for 45 degrees rotation. 80% recognition have a match in the top 10 for 90 degrees.
Face Orientation • Current face recognition systems experience difficulties in recognizing probes that differ from a frontal gallery more than 32 degrees. • Hyperspectral images achieve accurate recognition results for larger rotations!
Face Orientation Recognition (a)Female (b)male (c)asian (d)caucasion (e)black (f)18-20 (g)21-30 (h)31-40 (i)over 40.
Table Analysis • Four table analysis : front view – Neutral expression probes, front view – changed expression probes, 45 degrees rotation , 90 degrees rotation – For all categories Example: • Female probes tend to false match with female images in the gallery. • Same is for Male and Asian probes.
Duplicates 98 probes from 20 subjects at 3 days and 5 weeks. 92% have correct match in the top 10.
Duplicates • Performance duplicates is similar when acquired within one week or over. • Significant reduction in recognition accuracy for images not acquired on the same day as the gallery. • Assumptions: drift in sensor characteristics or changes in the subject conditions including variation in blood, water concentration, melanin concentration… • Hyperspectral imaging has potential for face recognition over time!
Conclusion • Purpose : • Face recognition over time in the presence of changes in facial pose and expression. • Implementation : • Hyperspectral images over the NIR (0.7 nm-1 nm), • Images for 200 subjects. • Spectral comparison of combinations of tissue types.
Conclusion • Results : • Performs significantly better than current face recognition for rotated faces. • Accurate recognition performance for expression changes and for images acquired over time intervals. • Expectations : • Further improvement by modeling spectral reflectance changes due to face orientation changes. • We use only spectral information. Improvement can be achieved by incorporating spatial information.
Second Article:Illumination Invariant Face Recognition Using Near Infrared Images . Stan Z. Li, Senior Member, IEEE, RuFeng Chu, ShengCai Liao, and LunZhang April 2007
The Problem • Lighting conditions drastically change the appearance of a face. • Changes between images of a person under different illumination conditions are larger than those between the images of two people under the same illumination.
The Problem • Lighting is the top most issue to solve for reliable face-based applications. • The system should adapt to the environment and not vice versa.
Current Face Recognition Systems • Most current face recognition systems are based on face images captured in the visible light spectrum. • These systems are compromised in accuracy by changes in the environmental illumination. • Most of these systems are designed for indoor use.