Download
1 / 26
270 likes | 414 Views
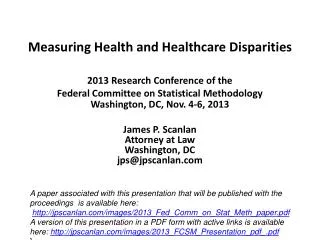
Measuring Health and Healthcare Disparities. 2013 Research Conference of the Federal Committee on Statistical Methodology Washington, DC, Nov. 4-6, 2013 James P. Scanlan Attorney at Law Washington, DC jps@jpscanlan.com. Key Points.

E N D
Measuring Health and Healthcare Disparities 2013 Research Conference of the Federal Committee on Statistical Methodology Washington, DC, Nov. 4-6, 2013 James P. Scanlan Attorney at Law Washington, DC jps@jpscanlan.com
Key Points • Standard measures of differences between outcome rates (proportions) are problematic for measuring health and healthcare disparities because each is affected by the overall prevalence of an outcome. • Health (including healthcare) disparities research is in disarray because researchers and institutions rely on a chosen measure without recognizing the way each measure is affected by the overall prevalence of an outcome. • There exists only one answer to the questions of whether a disparity has increased or decreased over time or is otherwise larger in one setting than another. • That answer can be divined, albeit imperfectly, by deriving from each pair of outcome rates the difference between means of the underlying risk distributions.
Key Questions • Assuming standard measures of differences between outcome rates are in some manner affected by the prevalence of an outcome, can disparities research be of value without taking effect of prevalence into account? • Can determinations of whether health disparities are increasing or decreasing over time turn on value judgments? • Is it ethical to present a finding as to direction of change of a health disparity without stating that another measure would yield a different result?
Key References Explaining Patterns Described Here • Measuring Health Disparities, Mortality and Survival, Immunization Disparities, and Scanlan’s Rule pages of jpscanlan.com • “Misunderstanding of Statistics Leads to Misguided Law Enforcement Policies” (Amstat News, Dec. 2012),“Can We Actually Measure Health Disparities?” (Chance, Spring2006), “Race and Mortality” (Society, Jan/Feb2000), “Race and Mortality Revisited” (Society May/June 2014) (in press) • Harvard University Measurement Letter(Oct. 9, 2012)
Patterns of Distributionally-Driven Changes in Standard Measures of Differences Between Outcome Rate – The Two Relative Differences • The rarer an outcome, the greater tends to be the relative difference in experiencing it and the smaller tends to be the relative difference in avoiding it. Thus, for example: • As mortality declines, relative differences in mortality tend to increase while relative differences in survival tend to decrease. • As rates of appropriate healthcare increase, relative differences in rates of appropriate care tend to decrease while relative differences in rates of failing to receive appropriate care tend to increase. • Relative racial, gender, socioeconomic differences in adverse outcomes tend to be larger, while relative differences in favorable outcomes tend to be smaller, among comparatively advantaged subpopulations (well-educated, high-income, insured, young, British civil servants) than among comparatively disadvantaged subpopulations. • See pages 7-9 of Harvard Letter for other examples.
Patterns of Distributionally-Driven Changes in Standard Measures of Differences Between Outcome – Absolute Differences and Odds Ratios • As uncommon outcomes become more common, absolute differences tend to increase; as already common outcomes become even more common, absolute differences tend to decrease. Absolute differences tend to track the direction of change of the smaller relative difference. See Introduction to Scanlan’s Rule page for nuances. Thus, for example: • As procedures like cardiac bypass graft surgery and certain uncommon types of immunization increase, absolute differences tend to increase. • As procedures like mammography, prenatal care, common types of immunization increase, absolute differences tend to decrease. • Higher-performing hospitals tend to show larger absolute differences for uncommon procedures, but smaller absolute differences for common procedures , than lower-performing hospitals. • As survival rates increase for cancers with generally low survival rates, absolute differences will tend to increase; as survival rates increase for cancers with generally high survival rates, absolute differences will tend to decrease. • Differences measured by odds ratios tend to change in the opposite direction of absolute differences (hence to track the larger relative difference).
Caveat One • Do not be distracted by the fact that one commonly finds departures from the patterns described here. Observed patterns are invariably functions of • (a) the strength of the forces causing rates to differ and • (b) the prevalence-related/distributionally-driven forces described here. • Society’s interest is solely in (a). • Only with an understanding of (b) can one discover (a).
Caveat Two • Do not think that presenting relative and absolute differences (or even both of the two relative differences and the absolute difference) by any means addresses the issues raised here. • The fundamental problem is that none of the measures is statistically sound.
Fig. 1. Ratios of (1) DG Fail Rate to AG Fail Rate and (2) AG Pass Rate to DG Pass Rate at Various Cutoff Points Defined by AG Fail Rate
Fig. 2: Absolute Difference Between Rates at various Cutoffs Defined by AG Fail Rate
Fig. 3 Ratios of (1) DG Fail Rate to AG Fail Rate, (2) AG Pass Rate to DG Pass Rate, (3) DG Failure Odds to AG Failure Odds; and (4) Absolute Difference Between Rates Zone A ●
Other Illustrative Data on jpscanlan.com • NHANES Illustrations • Life Tables Illustrations • Income Illustrations • Credit Score Illustrations • Framingham Illustrations
Key Government Approaches to Disparities Measurement • National Center for Health Statistics (Health People 2010, 2020, etc.) (see Section E.7 of the Measuring Health Disparities page) • relative difference in adverse outcomes • Agency for Healthcare Research and Quality (National Healthcare Disparities Report) • until 2010, whichever relative difference (favorable or adverse) is larger; after 2010, relative difference in adverse outcomes • Centers for Disease Control and Prevention (Jan. 2011 Health Disparities and Inequalities Report) • (usually) absolute difference between rates
Table 1: Varying Appraisals of the Comparative Degree of Employer Bias Using Different Measures of Disparities in Selection/Rejection (as an illustration that choice of measure does not involve a value judgment and that all standard measures are unsound) • Approach 1 (relative favorable): A,B,C,D • Approach 2 (relative adverse): D,C,B,A • Approach 3 (absolute difference: C,B,D,A • Approach 4 (odds ratio): A,D,B,C
How to Measure a Disparity • Derive from any pair of outcome rates the differences between means of the hypothesized underlying distributions in terms of standard deviations. • EES for “estimated effect size” • Probit coefficient • See Solutions subpage of Measuring Health Disparities page of jpscanlan.com regarding limitations, nuances.
Table 3. Changes in White and Hispanic Mammography Rates, with Measures of Differences (from Keppel 2005) Keppel KG, Pamuk E, Lynch J, et al. Methodological issues in measuring health disparities. National Center for Health Statistics. Vital Health Stat 2(141). 2005.
Table 4: Changes in Total and Black Rates of Pneumococcal and Influenza Vaccination Rates, 1989-1995 (HHS Progress Review: Black Americans, Oct. 26, 1998)
Table 5: Illustration Based on Morita (Pediatrics 2008) Data on Black and White Hepatitis-B Vaccination Rates Before and After School-Entry Vaccination Requirement (see Comment on Morita)
Table 6: Illustration Based on Hetemaa et al. (JECH 2003) Data on Finnish Revascularization Rates, 1988 and 1996, by Income Group (see Comment on Hetemaa)
Table 7: Illustration Based on Werner (Circulation 2005) Data on White and Black CABG Rates Before and After Implementation of CABG Report Card (see Comment on Werner)
Table 8. Illustration of Changes in Absolute Differences of Time s to Outcomes of Different Prevalence (Re Pay for Performance)
Table 9. Illustration of Absolute Differences at Low and High Performing Hospital as to Outcomes of Different Prevalence (Re Pay for Performance) Highlighted rows reflect situation of Massachusetts Medicaid pay for performance program. See page 21-24 of the Harvard Letter and Between Group Variance subpage of Measuring Health Disparities page.
Table 10. Illustration from Albain (J Nat Cancer Inst 2009) Data on Survival Rates of White and Black Women for Various Types of Cancers, from Albains et al., with Disparities Measures (see Mortality and Survivalpage)
Table 11. Illustration from Harper (CEBP 2009) Data on Racial Differences in Mammography (see Comment on Harper) Abstract: “In contrast, relative area-socioeconomic disparities in mammography use increased by 161%.” Text: Whether a health outcome is defined in favorable or adverse terms (e.g., survival versus death) can affect the magnitude of measures of health disparity based on ratios (11, 12). Consistent with the Healthy People 2010 framework for comparing across outcomes (13), we measured all breast cancer outcomes in adverse terms. 11. Keppel KG, Pearcy JN. Measuring relative disparities in terms of adverse events. J Public Health Manag Pract 2005;11:479 – 83. 12. Keppel K, Pamuk E, Lynch J, et al. Methodological issues in measuring health disparities. Vital Health Stat 2005;2(121):1 – 16.
Healthy People 2010 Technical Appendix at A-8 Those dichotomous objectives that are expressed in terms of favorable events or conditions are re-expressed using the adverse event or condition for the purpose of computing disparity [12 [sic],18,19], but they are not otherwise restated or changed. 13. Keppel KG, Pearcy JN, Klein RJ. Measuring progress in Healthy People 2010. Statistical Notes, no. 25. Hyattsville, MD: National Center for Health Statistics. September 2004. 18. Keppel KG, Pamuk E, Lynch J, et al. Methodological issues in measuring health disparities. National Center for Health Statistics. Vital Health Stat 2(141). 2005. 19. Keppel KG, Pearcy JN. Measuring relative disparities in terms of adverse outcomes. J Public Health Manag Pract 11(6). 2005.