Download
1 / 35
350 likes | 471 Views
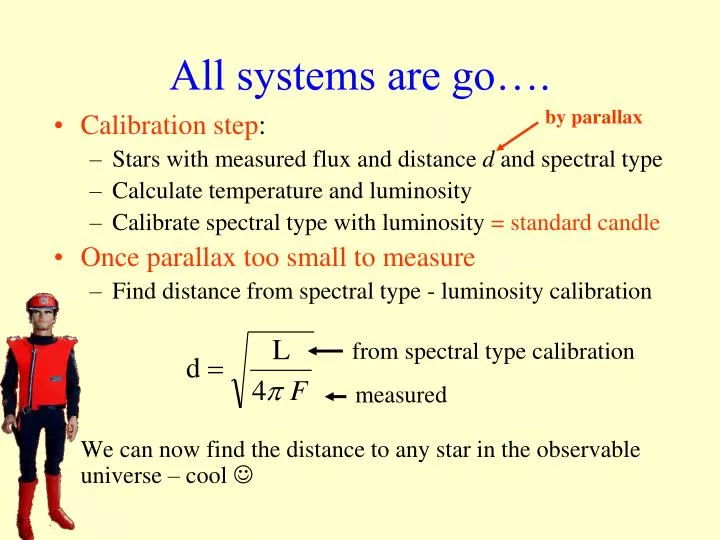
from spectral type calibration. measured. All systems are go…. by parallax. Calibration step : Stars with measured flux and distance d and spectral type Calculate temperature and luminosity Calibrate spectral type with luminosity = standard candle Once parallax too small to measure

E N D
from spectral type calibration measured All systems are go…. by parallax • Calibration step: • Stars with measured flux and distance d and spectral type • Calculate temperature and luminosity • Calibrate spectral type with luminosity = standard candle • Once parallax too small to measure • Find distance from spectral type - luminosity calibration • We can now find the distance to any star in the observable universe – cool
The long and the short of it…(what the observations tell us about stardom) 3000 K < temperature < 105 K 10-6 L < luminosity < 106 L 0.1 M < mass < 100 M Not well known massive stars are very rare ~ 100 MJupiter From Kepler’s 3rd law and observations of binary star orbits see ASTR 202
Making sense of the stars Henry Norris Russell (1877 - 1957) Ejnar Hertzsprung (1873 - 1967)
The HR diagram • Circa 1910 Ejnar Hertzsprung and Henry Russell compared luminosity and spectral types of near-by stars with known parallaxes • The HR diagram is: • a graph of Luminosity versus Spectral type Recall - requires a known parallax Recall - based on observed spectral lines (temperature)
No longer an N spectral type Red giants The original HR diagram (Russell, Nature, 93, 1914) Not the most convincing diagram, but it hints at the possibility that most stars fall on a diagonal line (bright high temperature stars to faint low temperature stars) and that there are giant and dwarf stars White dwarfs
Schematic HR diagram Red Giants Betelgeuse Bright Arcturus Sirius Luminosity Sun Main sequence White Dwarfs Proxima Centauri Dim O B A F G K M Spectral type Hot Cool
No need to copy table Within 100 pc of the Sun Spectral Type Number Comments • O stars 0 (first one ~ 300 pc distant) • B stars 100 • A stars 500 (closest type is Sirius A) • F stars 3000 • G stars 6000 (8% of stars are Sun-like) • K stars 10,000 • M stars 50,000 (72% - most common type) • WD stars 5000 (more on these later)
Selection effects at work • M spectral type, red dwarf stars are the most common kind of stars in the galaxy • Proxima Centauri: • Is the closest star to us (after the Sun) • Is an M spectral type star • Is not visible to the naked eye • A rather thought provoking result: • As human beings we cannot see with the naked-eye a single one of the most common type of star within our galaxy
Fundamental results • Stars do not fall at random in the HR diagram • Majority of stars (92%) lie in the main sequence band (the Sun is an MS star) • Most common stars have a K or M spectral type • Sun-like stars are relatively rare (8% of total MS population) • Red Giants (1%) and White Dwarfs (7%) make up the remaining number of (none MS) stars in the HR diagram • Big question: “what does it all mean ?”
Implications of HR diagram are: • The temperature and luminosity of a star are not arbitrary quantities • stars do not plot randomly in the HR diagram • On MS or in giant / white dwarf regions • implies a relationship between the physical properties of a star – mass, size, temp., etc • Why giant and dwarf stars ? • implies properties of stars change with time • more on this later + see also Astronomy 202
Main sequence stars • Characteristics: 0.1 < M/M < 100 10-4 < L/L < 105 3000 < T (K) < 30,000 • Very important result from binary star studies: • mass - luminosity (ML) relationship for MS stars • The more massive a star is the greater is its luminosity O stars M stars
Binary stars – two stars in orbit about a common center - analyze light variations to determine orbit and use Kepler’s 3rd law to find star masses (see ASTRO page 113, figure 6.13) Slope 3.5 Log L/L Log m/m For ms stars only: L/L = (m/m)3.5 Implication: The mass of a star determines its luminosity
Schematic HR diagram Red Giants Betelgeuse Bright Arcturus From parallax and flux Sirius Luminosity Sun Main sequence White Dwarfs Proxima Centauri Dim O B A F G K M Spectral type Hot Cool
On the Main Sequence Mass is the most important factor in determining the luminosity, size and temperature of a star M-L-R relationship exists since stars fall along the diagonal of the cube, rather than at random locations within it
The star chain L-M law for MS stars Star formation determines mass Luminosity Mass of star Sets position on main sequence in HR diagram Main sequence location sets star temperature and radius
Schematic HR diagram Luminosity Red Giants Mass set by star formation L set by mass- luminosity relationship Sun Main sequence White Dwarfs T set by MS location and L L ~ M 3.5 O B A F G K M Spectral type Hot Temperature Cool
The HR diagram(the fictional character version) Red Giants Main sequence Bright increasing mass Luminosity White Dwarfs Sun Red Dwarfs Dim Spectral type O B A F G K M Hot Cool
White dwarfs and red giants • The colour of a star relates to its temperature • Recall: Wien’s law: lmax T = constant • Blue / white • Means lmax is in the blue to UV part of the spectrum • Hence: Must be hot stars: T ~ 15,000 K • Red • Means lmax is in the red to IR part of the spectrum • Hence: Must be cool stars: T ~ 3000 K
Lines of constant radius in the HR Diagram 100 R Increasing radius (from lower left to upper right) Giant stars 10 R 1 R Luminosity (L) 0.1 R Lines of constant radius Dwarf stars Temperature (T)
Red dwarfs and Red giants Have the same temperature (i.e. SP type), but will have very different luminosity and radius values Red giants Red giant (L, R) >> Red dwarf (L, R) White and Red dwarfs have the same size, but different temperatures and luminosity's WD (L, T) > RD (L,T)
A Main Sequence Star – the SUN more than just a sphere of light: An active spectral type G2 star Sunspots – regions of lower temperature and strong magnetic fields
Photosphere (where absorption lines are formed) Optical image - Photosphere (T ~ 5800 K) UV image of outer Corona + solar wind + a coronal mass ejection (CME) Corona X-ray image - Corona (hot outer atmosphere T ~ 106 K) Coronal hole
If CME material (electrons & protons) ‘hits’ the Earth then it is channeled to the magnetic poles and an aurora may occur Aurora as seen from the International Space Station UV light image of Earth’s auroral oval Green colour from excited oxygen emission lines Red / blue colour from excited nitrogen emission lines
The Active Sun • Corona • Outermost layer of the Sun’s atmosphere • High temperature plasma with T ~ 1 million K • Heated by magnetic fields generated in Sun’s deep interior • Solar wind • Out flow of charged particles (mostly electrons and protons) from coronal holes – seen as dark regions at X-ray wavelengths • At Earth solar wind speed is 500 km/s • Mass lost is about 10 million tonnes (1010 kg) per second • CME’s – coronal mass ejections – explosive ejection of large amounts of solar wind material – can cause aurora on Earth and damage to spacecraft in Earth orbit.
Sunspot Cycle • Sunspots = localized regions of intense magnetic field pushing into the photosphere – results in cooler temperatures by about 1000 K • Sun’s internal magnetic field varies (changes in the north-south polarity of sunspots) on a timescale of about 22 years • This variation is seen in the 11 year sunspot cycle – where the number of visible sunspots varies from virtually none to perhaps a few hundred • Butterfly diagram: early in the sunspot cycle the sunspots appear at high latitudes (polar regions) – towards solar maximum sunspots appear mostly at lower latitudes (towards equator) • Butterfly effect and sunspot cycle are due to the Sun’s differential rotation - having a slower rotation rate at its poles (30 days) than at its equator (25 days)
11 year cycle 22 year cycle
The combined effects of the the Sun’s differential rotation and its internal magnetic field generation produce regions of twisted magnetic fields that can break through into the photosphere and produce sunspots (ASTRO: 92-94)
Sunspot cycle governed by the time for an ordered magnetic field to become twisted into a totally disordered magnetic field
The sunspot cycle on other Sun-like stars Observations indicate that sunspot cycles can be as short as 5 and as many as 25 years long, sometimes it stops all together. Our Sun: The Maunder Minimum (1645 -1715) – the sunspot cycle stopped for about 70 years – corresponded to the Little Ice Age revealing a subtle Sun-activity Earth-climate link
Variations in the sunspot cycle, the solar wind, and energy output (insolation) as well as changes in Earth’s orbit all have an affect upon Earth’s climate These climate effects are further compounded in the modern era by human activity – e.g., CO2 release
For every Sun-like star there are 8 Proxima-like stars in the galaxy Mass = 0.123 M Radius = 0.145 R Luminosity =0.002 L Proxima Centauri (M spectral type - Red Dwarf Star)
Orbit of Sirius B Sirius A Sirius A (an A type star) 2.6 parsecs (8.6 ly) away from Sun Sirius B (White Dwarf) Sirius A is the brightest star in the sky, and it has a White Dwarf (binary) companion: P ~ 50 years, MSiriusB ~ MSun, RSiriusB ~ REarth, LSiriusB ~ 0.03LSun
Over 1000 times larger than the Sun: A red supergiant Distance ~ 200 pc M ~ 15 MSun L ~ 120,000 LSun
Proxima ~ size of Jupiter Jupiter ~ 11 x size of Earth Sirius A (A type star) ~ 4 x Sun Sirius B (white dwarf) ~ size of Earth Arcturus ~ 52 x Sun = 1 / 100th size of Sun