Download

1 / 17
180 likes | 307 Views
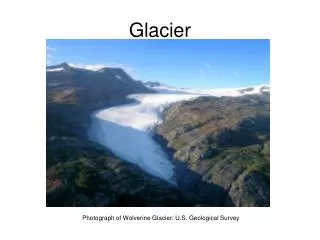
Investigating Glacier Earthquakes. Tectonic and Glacial Earthquakes. Tectonic earthquakes: Result from release of elastic strain across a fault surface Usually detected by high-frequency P-waves M = 5 usually last about 2 sec, M = 7 about 20 sec. Glacial earthquakes:

E N D
Tectonic and Glacial Earthquakes Tectonic earthquakes: • Result from release of elastic strain across a fault surface • Usually detected by high-frequency P-waves • M = 5 usually last about 2 sec, M = 7 about 20 sec Glacial earthquakes: • Usually have a slow source process and generate long-period signals • Until recently, these were missed by traditional detection methods, among ‘Earth Noise’
Fig. 1 Annual Reviews
Fig. 1 Seismic records of a glacial earthquake • Long-period Rayleigh wave arrivals at globally distributed stations ranging for a glacial earthquake at Kangerdlugssuaq glacier, East Greenland, on December 28, 2001. • Seismograms after propagation effects from the source location to each station have been removed, and envelope of the waveform has been calculated. Coloring of each seismogram reflects probability that surface-wave energy has been detected; red indicates the highest probability. • The bottom trace is a stack of the individual station traces. Alignment of individual detections indicates presence of Rayleigh wave energy emanating from a location near Kangerdlugssuaq glacier.
Fig. 2 Annual Reviews
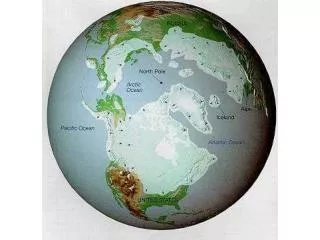
Greenland Earthquakes 1993 - 2008 Fig. 2 shows the locations of 252 earthquakes detected between 1993 and 2008. • What patterns do you see? • What surface features might be found where clusters of quakes occur? • Why don’t quakes occur elsewhere in Greenland?
Fig. 3 Annual Reviews
Seasonality of Glacial Earthquakes Fig. 3a shows the number of earthquakes detected per month What pattern do you see?Fig. 3b shows the number of earthquakes detected during 1993 – 2008. What pattern do you see? What might explain these patterns?
Fig. 5 Annual Reviews
Fig. 5 Map shows locations of GPS stations (blue and yellow dots) operated by Nettles et al. on Helheim glacier during July and August 2007, overlain on a 2001 Landsat image. Arrows show average velocities over this time period. GPS stations nearest the calving front were moved mid-season to the locations shown by the yellow dots. Red dots represent locations of rock-based GPS reference sites. Dashed lines show the location of the calving front at the beginning (eastern line) and end (western line) of the network operation period. Inset shows location of Helheim glacier in southeast Greenland (black arrow) and locations of glacial earthquakes (white dots) after Tsai & Ekström (2007). What do the numbers on the x- and y-axes represent? What patterns can you detect in the velocity data?
Fig. 4 Schematic showing position and velocity expected on the surface of a glacier, at a location shown by the disk-shaped GPS antenna, for a glacial earthquake source model in which: (a) the trunk of the glacier lurches forward abruptly and (b) resistance to flow in the glacier trunk is reduced as a result of a large calving event. Position curves are drawn as residuals with respect to an assumed-constant pre-earthquake velocity.
Fig. 8 Annual Reviews
Two types of calving at Helheim Glacier • On July 25, 2006, during a period without glacial earthquakes. Width of ice to right of rift is approximately 1 km. Several recently calved icebergs that remained upright as they moved away are visible at top right. View is to north; glacier flow is to right (east). • (b) On August 19, 2008, during a large calving event that generated a glacial earthquake. View is to south; glacier flow is to left (east). Time progresses from top, with bottom image taken approximately 3 min after top image. In top photograph, calving iceberg has begun to capsize, with top of the iceberg rolling down to the right against calving face. In bottom photograph, iceberg has reached horizontal position, exposing its full thickness (700 m). Height of the calving face is 70 m. What might you deduce about calving and earthquake occurrence?
Fig. 9 Annual Reviews
Fig. 9 shows locations of 14 teleseismic detections in Antarctica that might be glacial earthquakes. • Why might there be fewer such events in Antarctica than Greenland?
True or False? • In the studies of Ekström et al. (2003, 2006) and Tsai & Ekström (2007), mass-sliding product was interpreted to result from a large mass—perhaps 10 km3 of ice within the glacier trunk—sliding a relatively short distance of 1–10 m. • Equally consistent with seismic modeling result is acceleration of a smaller mass over a larger distance. • A large, newly formed iceberg of approximately 0.5–1 km3 accelerating away from the calving front must undergo a center-of-mass translation of only a few tens to a few hundred meters to produce a mass-sliding product like that observed. • Consideration of the newly formed iceberg as the slide mass, and hence the seismogenic source, provides an explanation for the glacial earthquakes as part of the ice-loss process at the glacier calving front.